Biology (AEES)
Archives of Earth and Environment Sciences
Full Text
Volume 1, Issue 1
Distribution and Behaviour of Four Polyaromatic Compounds in Oil Facilities in Mexico
*Corresponding Author: Iturbe AR, Institute of Engineering, National Autonomous University of Mexico, Mexico, Tel: +52-5549447202, E-mail: ria@pumas.ii.unam.mx
doi: /aees.2021.2.102
Citation: Mendoza MJA, Corona RL, Iturbe AR, Castro RAA (2021) Distribution and Behaviour of Four Polyaromatic Compounds in Oil Facilities in Mexico. Arch Earth Environ Sci 1: 1-14
Copyright: © 2021 Iturbe AR. This is an open-access article distributed under the terms of Creative Commons Attribution License, which permits unrestricted use, distribution, and reproduction in any medium, provided the original author and source are credited.
Abstract
The objective of this work is to obtain the distribution and correlation between PAHs present in more than 50 sites evaluated since 2001. The research group on “Remediation of soils and aquifers from Instituto de Ingeniería, UNAM” has characterized soils of various hydrocarbon storage sites, such as refineries, storage tanks, distribution petroleum terminals and pumping plants from PEMEX, in different parts of the country, with the purpose of knowing the contamination by hydrocarbons and petroleum products.
Due to the importance that polynuclear aromatic hydrocarbons (PAHs) represent for human health, this research focused on the presence of PAHs in various soils of the country, through sampling and analysis, in sites with petroleum influence. Soils samples were analyzed, using the EPA 8310 method, from sites associated with leaks of collectors, drains, pumps, ducts and storage tanks.
The compounds benzo(a) pyrene, benzo(a)anthracene, benzo(b)fluoranthene, benzo(k)fluoranthene, have a higher concen- tration in the states of Oaxaca and Aguascalientes in silty clay soils.
The best relationship was for benzo(b)fluoranthene vs benzo(k)fluoranthene, since it presented a very favorable correlation coefficient and error “xy”, therefore it is considered that the linear equation adapts to the relationship between these two compounds. It was observed that the least favorable ratio was for benzo (a) pyrene vs benzo (a) anthracene since there is no linearity in the relationship between both compounds.
Keywords: Hydrocarbons; PAH; Contaminated Soils
Introduction
Polyaromatic compounds are part of the group of hazardous organic chemical compounds that exist naturally or may be of anthro- pogenic origin [1]. They have different number and position of their rings; They are generally of high molecular weight, low solubility and volatility and high adsorption capacity. They originate due to incomplete combustion of petroleum products, wood, and a wide variety of industrial processes, such as coal gasification processes, oil refining, coking, etc. [2]. Their physical and chemical properties vary according to their molecular weight and their distribution depends on these characteristics as well as on the properties of the soils as well as their effects on biological systems [3-5]. Due to their toxic, mutagenic and carcinogenic characteristics and the per- sistence of these compounds in contaminated soils and sediments, the remediation for these cases is very complex due to the presence of recalcitrant molecules that persist in the environment and increase the adsorption of soil organic matter and reduce the chances of biodegradation [3,6-10]. Influence processes in turn depend on the relationship between soil organic matter and clay content in each case [11,12].
Bacteria and fungi are valuable for the biotransformation of PAH [13] and are the path for their transformation [14-16]. However, for its biodegradation to be achieved, it is necessary to take into account the physical, chemical and biological properties. The most important are organic matter in the soil that controls biodegradation [17] and the number of rings. It has generally been shown that biodegradation in PAH of low molecular weight occurs faster than for those of high molecular weight [15].
Bioavailability of sorbed contaminants to microorganisms has been reported to be a major limitation for successful bioremediation of contaminated sites [17-20]. The ability of soil to desorb contaminants determines its susceptibility to microbial degradation, thereby influencing the effectiveness of bioremediation processes. Kinetics for desorption of PAHs from contaminated matrices is biphasic: an initial rapid desorption phase is followed by a slow desorption phase. Microbial activity is an important parameter controlling desorption kinetics during the initial desorption phase. Li et al (2009) [15] reported a biphasic pattern of PAHs during aging and demonstrated that the rapid diffusion of PAH from labile to nonlabile domains was primarily dependent on the distribution of mi- cropore fraction and total organic carbon content An unavailable PAH fraction may also exist in contaminated soils and sediments: this residual fraction may occur as a result of incorporation of sorbed contaminants into the soil/sediment organic matrix [21] these studies further demonstrate the significant role of organic matter on PAH sorption–desorption and subsequent degradation in con- taminated soils.
Table 1 shows the permissible limits for the six PAH selected by Mexican regulations (DOF, 2012) [22]
Materials and Methods
The sampling consisted of the extraction of soil cores at each selected site. Pneumatic drilling equipment was used with a 12 HP motor, variable drilling velocity and a pressure of 2000 psi, from the surface to 3 m deep. Soil samples were obtained at 46 sites in 8 states of Mexico: Aguascalientes, Chihuahua, Coahuila, Durango, Estado de México, Monterrey, Oaxaca, Veracruz y Zacatecas, and four PAH, benzo (a) pyrene, benzo (a) anthracene, benzo (b) fluorantene and benzo (k) fluorantene were analyzed.
The frequency of the concentrations for each of the compounds with ArcGIS 10.2.2 was analyzed and a geostatistical analysis of these four compounds and their comparison between them was performed. Table 2 presents the sampling points, identification and location. Table 3 shows the concentrations of each PAH at each sampling point.
Results
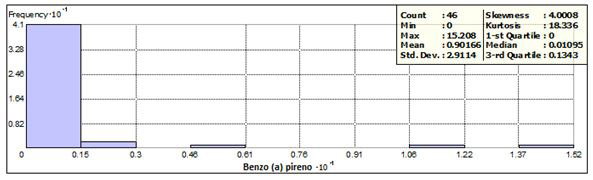
Benzo (a) pyrene was detected in 27 of the 48 sites, with concentrations between 0.0024 to 15.2 (mg / kg). A frequency of 41 was obtained, corresponding to 89% in concentrations less than 1.5 mg / kg and distributed in 8 states. The frequency histograms, as well as the statistical data are presented in Figure 1. Two samples exceeded the permissible limits, located in Aguascalientes and Oaxaca with respective concentrations of 12.1 and 15.2 (mg / kg), with keys of identification AG-36 and SC 6 + 020 1A.
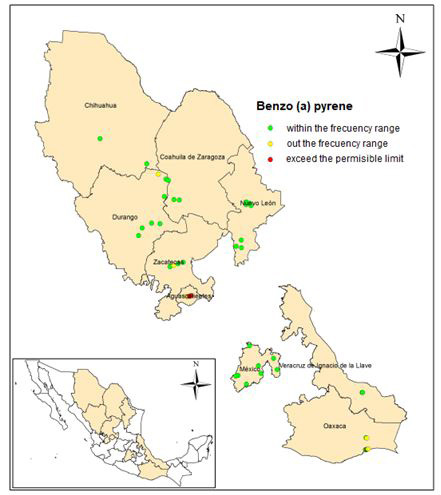
Figure 2 shows the sampling points grouped into: within the frequency, outside of it and the points with concentrations that exceed the permissible limit (10 mg / kg).
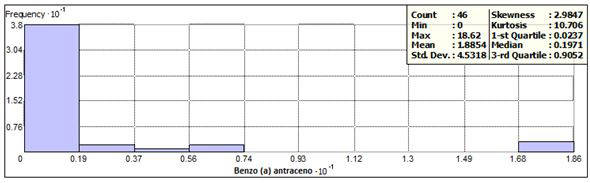
Benzo (a) anthracene was detected in 44 sites, with concentrations between 0.0079 to 18.62 (mg / kg). A frequency of 38 was ob- tained, corresponding to 82.6% in concentrations less than 1.9 mg / kg and distributed in 8 states. The frequency histogram, as well as the statistical data are presented in Figures 3 and 4. Three samples exceeded the permissible limits, located in Aguascalientes and Oaxaca with respective concentrations of 16.8, 18.1 and 18.6 (mg / kg), with keys of identification AG-35 AG-36 and SC 6 + 020 1A. Two of these samples also had concentration values above the permissible limit in benzo (a) pyrene.
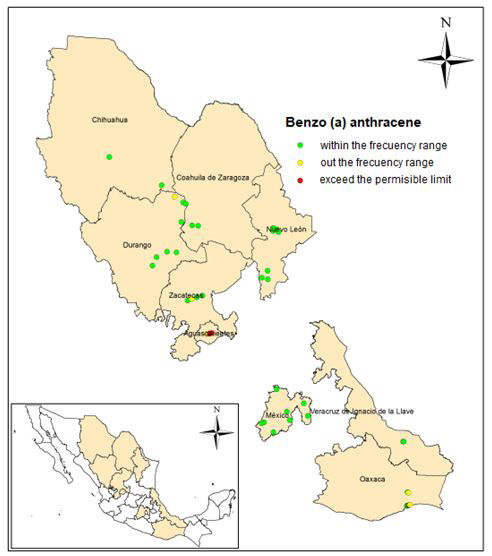
Figure 3 shows the histogram of frequencies and statistical data, and Figure 4 shows the location of the sampling points within the frequency range, outside it and the points at which there is a concentration above of the permissible limit (10 mg / kg).
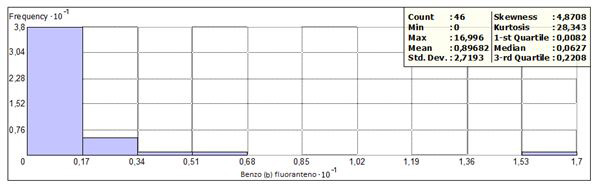
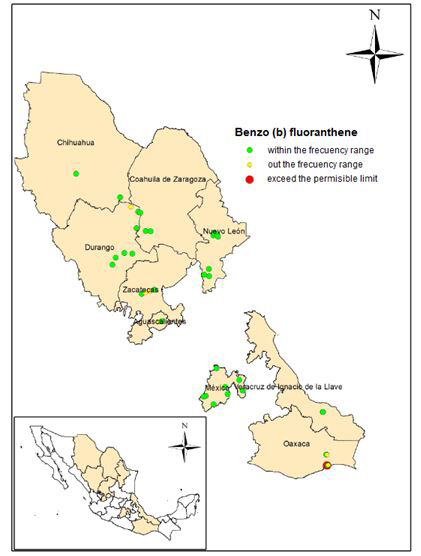
Benzo (b) fluoranthene was detected in 38 sites, with concentrations between 0.0022 to 17 (mg / kg). A frequency of 38 was obtained, corresponding to 82.6% in concentrations less than 1.7 mg / kg and distributed in 8 states. The frequency histogram, as well as the statistical data are presented in figures 5 and 6. Only one sample exceeded the permissible limits, located in Oaxaca with concentra- tion of 17 mg/kg with key of identification SC 6 + 020 1A. The same sample had concentration values above the permissible limit in benzo (a) pyrene and benzo(a)anthracene.
Figure 5 shows the histogram of frequencies and statistical data, and Figure 6 shows the location of the sampling points within the frequency range, outside it and the points at which there is a concentration above of the permissible limit (10 mg / kg).
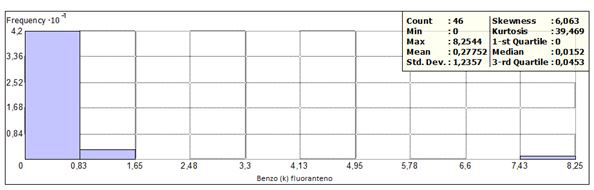
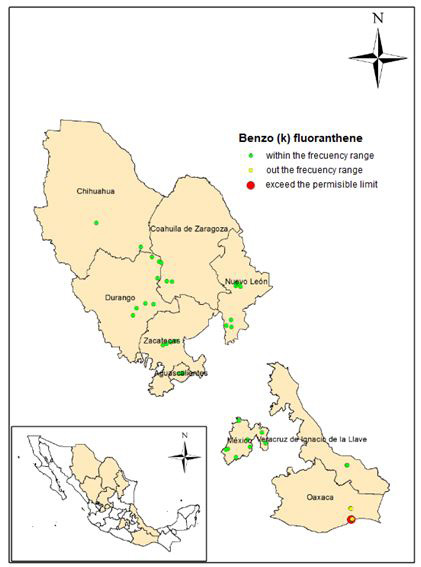
Benzo (k)fluoranthene was detected in 28 sites, with concentrations between 0.0035 to 8.25 (mg / kg), having a frequency greater than the concentration range less than 0.83 mg / kg (Figure 7) corresponding to 91%. The maximum concentration value (8.25 mg / kg) for this compound was found in the same point in Oaxaca, with the identification code SC 6 + 020 1A; however, it does not exceed the maximum permissible limit (80 mg / kg). The frequency histogram, as well as the statistical data are presented in Figures 7 and 8.
Figure 7 shows the histogram of frequencies and statistical data, and figure 8 shows the location of the sampling points within the frequency range, outside it and the points at which there is a concentration above of the permissible limit (10 mg / kg).
Relationship between the four compounds
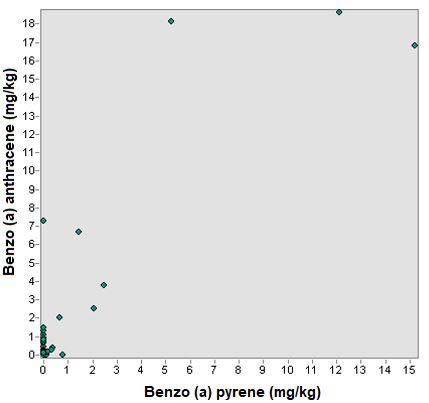
A linear trend model was used to analyze the relationship between the 4 PAH studied. Figure 9 shows the analysis of the relationship between benzo (a) pyrene and benzo (a) anthracene and there is no relationship between the concentrations of the different sampling points.
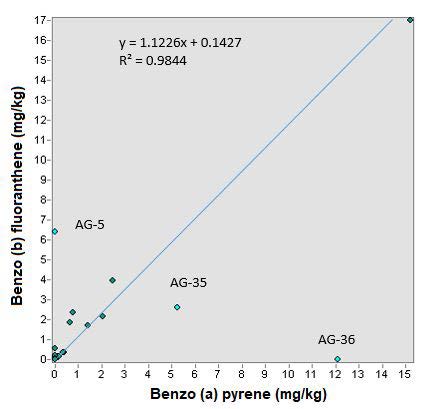
The ratio between benzo (a) pyrene and benzo (b) fluoranthene, has a good relationship. According to the trend line the correlation coefficient is 0.9844 and the typical error according to the regression is 36.7%. It can be said that the trend line fits the relationship equation (Figure 10). In this analysis the points of Aguascalientes were not taken into account.
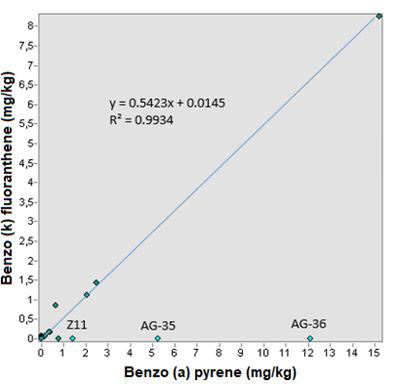
Regarding the relationship between the compounds benzo (a) pyrene and benzo (k) fluoranthene, the points of Aguascalientes and Zacatecas were not taken into account because they leave the trend line (Figure 11). In this way there is a correlation coefficient of 0.9934 and a typical “xy” error of 12.3%, which makes this relationship reliable through the linear trend equation (0.5423x + 0.0145) and it is concluded that there is a good correlation between these compounds.
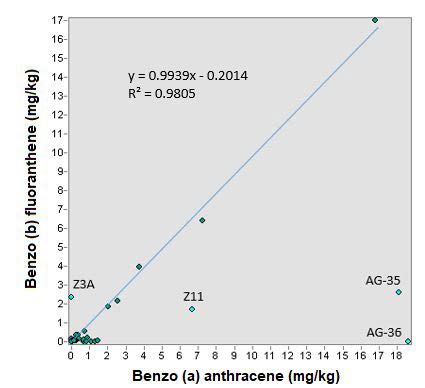
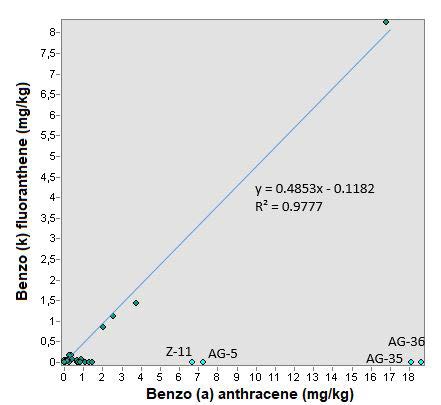
In the relationship of benzo (a) anthracene and benzo (b) fluoranthene, there is also linearity; In Figure 12, a correlation coefficient of 0.98 is observed through the generation of the trend line; however, the typical error “xy” was 39.9% which is greater than the ratio of the previous compounds, but it can be said that although this typical error, the linear trend equation is reliable and that there is a relationship between both compounds. The point of Aguascalientes y Zacatecas were not taken into account in this analysis.
In Figure 13 it can be seen that the trend line has a correlation of 0.9777 and a typical error of 20%, so it can be inferred that there is a relationship between both compounds.
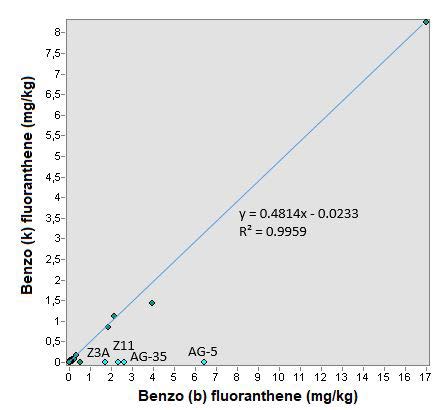
Finally the relationship between benzo (b) fluoranthene and benzo (k) fluoranthene is analyzed where it is observed that again the points that come out of the linearity correspond to the states of Aguascalientes and Zacatecas (AG-5, AG-35, Z3A and Z11), but still there is a better linearity than the ratio of the previous compounds. In Figure 14, there is a correlation coefficient of 0.996 and a typical “xy” error of 9.3%, confirming that this relationship between the two compounds is better than those previously analyzed and that the equation y = 0.4814x - 0.0233 adapts to the concentration ratio between these compounds [23-26].
Conclusions
The four PAHs analyzed, have the highest concentration in the states of Oaxaca and Aguascalientes, being the site of SC 0 + 620 1A, in which the highest concentrations were presented. Although for the benzo (k) fluoranthene there were no concentration values above the permissible limit, there are very high values compared to the remaining sampling sites.
Benzo (b) fluoranthene vs benzo (k) fluoranthene had the best relationship, since it has a very favorable “xy” correlation coefficient and error, which concludes that the linear equation adapts well to the relationship between these two compounds. It was also ob- served that the least favorable relationship was for the relationship between benzo (a) pyrene vs benzo (a) anthracene since no lin- earity was obtained in the relationship between both compounds.
Acknowledgements
Thanks to Carlos Flores as responsible for the field work
- Harayama S (1997) Polycyclic aromatic hydrocarbon bioremediation design. Environmental Biotechnology 8: 268-73.
- Suthersan SS (1997) Remediation Engineering. Design Concepts. CRC Press LLC, USA.
- Koshlat E, Ball A (2017) Soil bioremediation approaches for petroleum hydrocarbon polluted environments. AIMS Microbiology 3: 25-49.
- Dragun J (2001) Soil & Sediment Contamination, CRC PRESS, USA.
- Iturbe R, Flores RM, Flores C, Torres LG (2004) TPH-contaminated mexican refinery soil: Health Risk Assessment and the First Year of changes. Environmental Monitoring and Assessment 91: 237-55.
- Bamforth SM, Singleton I (2005) Review Bioremediation of polycyclic aromatic hydrocarbons: current knowledge and future di- rections. Journal of Chemical Technology and Biotechnology 80: 723-36.
- Cerniglia CE (1993) Biodegradation of polyclyclic aromatic hydrocarbons. Current Opinion in Biotechnology 4: 331-8.
- Enell A, Reichenberg F, Warfvinge P, Ewald G (2004) A column method for determination of leaching of polycyclic aromatic hy- drocarbons from aged contaminated soil. Chemosphere 54: 707-15.
- Abalos A, Vinas M, Sabate J, Manresa MA, Solanas AM (2004) Enhanced biodegradation of Casablanca crude oil by a microbial consortium in presence of rhamnolipid produced by Pseudomonas aeruginosa AT10. Biodegradation 15: 249-60.
- Grøn C, Oomen A, Weyand E, Wittsiepe J (2007) Bioaccessibility of PAH from Danish soils. Journal of Environmental Science and Health Part A 42: 1233-9.
- Maletic S, Dalmacija B, Roncevic S (2013) Petroleum Hydrocarbon Biodegradability in Soil-Implications for Bioremediation, Hydrocarbon.
- Amellal N, Portal JM, Berthelin J (2001) Effect of soil structure on the bioavailability of polycyclic aromatic hydrocarbons within aggregates of a contaminated soil. Applied Geochemistry 16: 1611-9.
- Wu YR, Luo ZH, Vrijmoed LL (2010) Biodegradation an anthracene and benz(a)anthracene by two Fusarium solani strains iso- lated from sediments. Bioresource Technology 101: 9666-72.
- Yuan SY, Wei SH, Chang BV (2000) Biodegradation of polycyclic aromatic hydrocarbons by a mixed culture. Chemosphere 41: 1463-68.
- Li X, Lin X, Li P, Liu W, Wang L, et al. (2009) Biodegradation of the low concentration of polycyclic aromatic hydrocarbons in soil by microbial consortium during incubation. Journal of Hazardous Materials 172: 601-5.
- Moscoso F, Deive MA, Longo MA, Sanromán MA (2015) Insights into polyaromatic hydrocarbon biodegradation by Pseudo- monas stutzeri CECT 930: operation at bioreactor scale and metabolic pathways. International Journal of Environment Science and Technology 12: 1243-52.
- Grosser RJ, Friedrich M, Ward DM, Inskeep WP (2000) Effect of model sorptive phases on phenanthrene biodegradation: differ- ent enrichment conditions influence bioavailability and selection of phenanthrene-degrading isolates. Applied and Environmental Microbiology 66: 2695-702.
- Chung N, Alexander M (1998) Differences in sequestration and bioavailability of organic compounds aged in dissimilar soils. Environmental Science & Technology 32: 855-60.
- Cornelissen G, Van Noort P, Govers HA (1997) Desorption of chlorobenzenes, polycyclic aromatic hydrocarbons, and polychlo- rinated biphenyls: sediment extraction with tenax and effects of contact time and solute hydrophobicity. Environmental Toxicology and Chemistry 16: 1351-7.
- Zhou W, Zhu L (2005) Distribution of polycyclic aromatic hydrocarbons in soil-water system containing a nonionic surfactant. Chemosphere 60: 1237-45.
- Haeseler F, Francoise B, Dominique G, Yves C (2010) First stoichiometric model of oil biodegradation in natural petroleum sys- tems: Part I .Organic Geochemistry 41: 1156-70.
- Diario Oficial de la Federación (DOF) (2012) Norma Oficial Mexicana:NOM 138-SEMARNAT/SS-2012, Mexico.
- Cerniglia CE (1992) Biodegradation of polycyclic aromatic hydrocarbons. Biodegradation 3: 351-68.
- EPA (1999) Guidance on cleanup levels equations and input parameters, Alaska Department of Environmental Conservation, Division of Spill Prevention and Response Contaminated Sites Remediaton Program, USA.
- Oleszczuk P (2009) Application of three methods used for the evaluation of polycyclic aromatic hydrocarbons (PAHs) bioacces- sibility for sewage sludge composting. Bioresource Technology 100: 413-20.
- Wang H, Wang X, Liu C, Wang Y, Rong L, et al. (2017) In-Situ Bioremediation of DDTs and PAH Contaminated Aging Farmland. Soil and Sediment Contamination 26: 623-35.