Biology (SPBR)
Stechnolock: Plant Biology and Research
Full Text
Volume 1, Issue 1
Genotype by Environment Interaction and Grain Yield Stability Analysis of Advanced TEF Genotypes for High Potential TEF Growing Areas of Ethiopia
*Corresponding Author: Yazachew G, Ethiopian Institutes of Agricultural Research; Debrezeit Agricultural Research Centre, Debre Zeit, Ethiopia, Tel: +251954644016, E-mail: yazachewgenet@gmail.com
doi: /spbr.2021.1.102
Citation: Yazachew G, Solomon Ch, Tsion F, Worku K, Kidist T et al. (2021) Genotype by Environment Interaction and Grain Yield Stability Analysis of Advanced TEF Genotypes for High Potential TEF Growing Areas of Ethiopia. Ethiopia. Stechnolock Plant Biol Res 1:1-10
Copyright: © 2021 Eche CO. This is an open-access article distributed under the terms of Creative Commons Attribution License, which permits unrestricted use, distribution, and reproduction in any medium, provided the original author and source are credited.
Abstract
Tef [Eragrostis tef (Zucc.)Trotter]) is one of the most important cereal crops grown in Ethiopia; the first crop in terms of acreage, however, its production has been partly constrained by low grain yield and less stability of the released tef genotypes under cultivation. This study was conducted to estimate the extent of genotype by environment interactions and stability in tef genotypes in the highlands of Ethiopia. Eighteen promising recombinant inbred lines plus a standard and local check variety were evaluated at six environments under rain-fed conditions using the randomized complete block design with four replications. AMMI analysis showed that tef grain yield was highly significantly (p < 0.001) affected by environments (E), genotypes (G), and genotype × environment interaction (GEI) indicating the presence of genetic variation and possible selection of stable entries. Thus, 50.6% of the total sum of squares was justified by environmental fluctuations showing that the environments were diverse to cause large variation in grain yield across test locations. GEI was further partitioned by principal component analysis and the first two multiplicative axis terms (PCA1, and PCA2) explained 45.5% and 20.7% (66.2%) of GEI sum of squares, respectively. The mean grain yield value of tested genotypes averaged over environments indicated that G4 (HO-TF-1486 x DZ-01-2787(RIL No. 173) had the highest grain yield of 2827 kg ha-1 compared to the standard check variety Negus with 2565 kg ha-1 grain yield. In addition, this candidate variety proved stable across environments for grain yield during the varietal evaluation experiment. This genotype, therefore, will be verified and evaluated by the national variety release committee in 2021/22 main cropping season for approval and release for high potential tef growing environments to increase tef production and productivity.
Keywords: AMMI Analysis; Stability; GEI, Tef Genotypes
Introduction
Tef, Eragrostis tef (Zucc.) Trotter is the most important cereal crop of Ethiopia in terms of production, consumption and cash crop value. In Ethiopia, tef is annually grown on about three million hectares involving over 7.1 million households with a total grain production of over 5.7 million tons [2]. As such, tef accounts for about 30% of the total cultivated area and one-fifth of the gross grain production of all cereals cultivated in the country [2]. Based on the archeological evidences, its husbandry was started in Axum, Ethiopia in 2700-2800 B.C [5]. Since then, extensive tef cultivation is continued due to its agronomic and dietary qualities. Tef adapts to extreme environmental conditions and present in diverse socio-economic conditions. Among the agronomic merits of the tef include broad and versatile agro-ecological adaptation; tolerance to both drought and water-logging conditions; fitness for various cropping systems and crop rotation schemes; usefulness as a reliable and low-risk catch crop at times of failures of other long-season crops such as maize and sorghum due to drought or pests; and little vulnerability to epidemics of pests and diseases in its major growing regions [3]. In terms of dietary qualities, tef grain is gluten-free and contains all eight essential amino acids, as well as high contents of fiber, minerals, and vitamins [23]. In addition, in terms of forage, it has high feed quality, crude protein content, fast growth rate, and its suitability for multiple harvests [16].
Genotype × environment interaction determines the phenotypic performance of the crop and its general and specific adaptation to different environments [7]. One of the most exigent issues in plant breeding progress is to perfectly dissect genotype x environment (G x E) interaction because it is based on figures from multi-environment experiments.
Additive main effects and multiplicative interaction (AMMI) and the genotype by environment (GGE) are some of the most widely used stability models to estimate the magnitude of GXE interactions [12, 18] to identify high-yielding and better-adapted genotypes [19]. GGE biplot, especially, is useful, to graphically represent the GE interaction, and to rank the studied genotypes and environments [27]. The AMMI model is a hybrid model involving both additive and multiplicative components of a two-way data structure which enabled a breeder to get a precise prediction on genotypic potentiality and environmental influences on it. It has been intensively used since it incorporates both the classical additive main effects for GEI and the multiplicative components into an integrated least square analysis and thus becomes more effective in the selection of stable genotypes [6, 8]. AMMI uses ordinary ANOVA to analyze the main effects (additive part) and principal component analysis (PCA) to analyze the non-additive residual leftover by the ANOVA [27]. The effectiveness of the AMMI procedure has been demonstrated by various authors using multi-location data in tef [1, 9, 31]. G x E interaction analysis or testing genotypes for wide and specific adaptation to a microenvironment is paramount for yield stability of tef varieties. As there are very limited studies on G x E in tef crop, the importance of conducting more studies across major tef growing environments has been suggested [9,31]. Thus, the understanding of G x E interaction enables breeders to determine the optimum breeding strategy to make informed choices of the locations and input systems to be used in the breeding efforts and to develop and release crop varieties suitable for various agro-ecologies. Therefore, the present study was undertaken to analyze the magnitude of GEI and evaluate the adaptability and stability of recombinant tef genotypes for grain yield, using the Additive Main Effects and Multiplicative Interaction (AMMI) model.
Materials and Methods
Plant materials
Eighteen recombinant inbred lines from two crossing parental lines plus a standard check and local check were evaluated in multi-environment; however, for homogeneity of data analysis only seven environments were used. The 18 promising recombinant inbred lines were obtained through the single seed descent (SSD) method from two different crosses (Table 1). From the two crosses, Ho-TF-1486 and Quncho (DZ-Cr 387RIL355) were used as the ovule parent while cultivar DZ-01-2787 and DZ-01-99 were used as the pollen parent. Cultivar Ho-TF-1486 is characterized by a high number of florets per spikelet and hence used to pyramid yield traits into the cultivar DZ-01-2787 which is a very white seed. Likewise, the Variety DZ-01-99 was the paternal parent for nine of the 18 RILs, and the cross of variety Quncho with DZ-01-99 aimed at introgressing higher panicle length for yield. The standard check variety was the variety Nigus released in 2017 [30] for agro-ecologies similar to the particular set of test locations and classified as high potential tef growing areas. On the other hand, the local check is a farmer’s variety commonly grown around each of the respective test locations.
Experimental Design and Management
The field experiment was conducted using a randomized complete block design with four replications of 2 m x 2 m (4 m2) plot size during the two main cropping seasons of 2019 and 2020. The field experiment was managed as per the research recommendation of agronomic practices of the respective test locations.
Data Collection
Grain yield (g) of each plot was measured on clean, sun-dried seed and the measured grain yield value (g) has converted to kilogram per hectare for data analysis.
Statistical Analysis
The first analysis of variance was made for each of the environments to know the existence of genetic variability among experimental genotypes and to verify the homogeneity of the error variances. The combined analysis of variance of the environment (location) and genotypes were performed, to identify the possible interactions of genotypes with environments. For the analysis of variance, Proc GLM (general linear model) suitable for the experimental design was employed using SAS software version 9.00 [21]. Adaptability and stability analyses were done using the multivariate AMMI and GGE-biplot methods after the significance of the GxE interaction was determined.
AMMI and GGE Biplot Analysis
The AMMI and GGE biplot package in R software, GEA-R (2015) version 2.0 was used for the analyses. The AMMI method combines ANOVA and PCA into a single analysis with both additive and multiplicative parameters [11]. The first part of AMMI uses the normal ANOVA procedures to estimate the genotype and environment main effects. The second part involves the PCA of the interaction residuals (residuals after the main effects are removed). The interaction G × E was analyzed in an AMMI model [11] to identify tef genotypes better adapted to different environments. AMMI’s stability value (ASV) was calculated. Stability per se might not be the only selection parameter because the most stable genotypes do not necessarily have the best yield performance [15, 17]. Both yield and stability were incorporated in a single index to classify stable genotypes. The genotype stability index (GSI) considered the ranks of the genotype yields across environments and AMMI stability values. This index incorporates the yield means and stability index in single criteria and is calculated: GSI = RASV+RY where RASV is the rank of ASV and RY the rank of mean genotype yield of all environments.
The GGE-biplot methodology, which is composed of two concepts, the biplot concept [10] and the GGE concept [27], was used to visually analyze the multi-environment yield trial (MEYTs) data. This methodology uses a biplot to show the factors (G and GE) that are important in genotype evaluation and that are also sources of variation in GEI analysis of MEYTs data [26, 27]. The data were graphically analyzed to interpret the GxE interaction to identify stable and adaptive genotypes by the GGE biplot, as described by [28]. The lines that connect the test environment to the biplot origin are called environment vectors and the cosine of the angle between the vectors of two environments approximates the correlation between them [29].
Result and Discussion
Additive main effect and multiplicative interaction (AMMI) analysis of variance
AMMI variance analysis for grain yield of 20 tef genotypes tested in seven environments is presented in Table 2. AMMI analysis indicated variation among E, G and G×E showed highly significant differences at level (P< 0.001), indicating the presence of genetic variation and possible selection of stable entries. The partitioning of sum squares (SS) indicated that the environment effect was a predominant source of variation followed by GE and genotype effect. In genotype variation, E explains most of the variation, when variations of G and G×E are usually smaller [26].
The application of the AMMI model for partitioning of GEI (Table 2) also revealed the first two principal component axis (IPCAs) of AMMI were highly significant (P< 0.001) and (P< 0.05), respectively using an approximate F-statistic [13]. The AMMI with IPCA1 and IPCA2 is the best predictive model for cross-validation of the yield variation explained by the GEI [9, 24, 30]. Components of variation of ANOVA from additive main effect and multiplicative interaction (AMMI) for grain yield showed highly significant (p ≤0.001) for genotypes and environments and genotype by environment interaction (GEI) effects. The effect of environment, genotypes, and genotype by environment interaction accounted for 50.57%, 14.72%, and 34.71% of the total sum squares (Table 2), respectively. A large sum of squares for environments indicated that the test environments were diverse with large differences among environmental means which causes most of the variation in grain yield. Therefore, this result designated the reliability of the multi-environment experiments. The variation in temperature, rainfall, soil type, soil fertility, and moisture availability might be the main reasons for the presence of variation. The AMMI analysis also showed that the first interaction principal component (PC1) and second interaction principal component (PC2) explained 45.51% and 20.69% of the interaction sum squares, respectively. Thus, the mean squares for the IPCA1 and IPCA2 cumulatively contributed to 66.2% of the total GEI. The model was adequate to explain the total genotype × environment interaction component [26]. The mean squares for PC1 were highly significant (p< 0.01) effect GEI for grain yield. The significant interaction indicated that the genotypes respond differently across different environments. The significant variability of genotypes traits showed in the present study for different traits of tef genotypes agree with the previous report by different authors for genotype variability [9, 24, 30].
Grain yield mean performance and stability of genotypes
The mean yield performance and stability of genotypes were evaluated by an average environment coordination (AEC) method [26].
Grain yield mean performance
The average grain yield of each environment and genotype are given in Table 3. The mean grain yield performances of the 20 advanced tef genotypes at each of the six environments are presented in Table 3. The overall mean grain yield of the 20 tef genotypes for the six environments ranged the lowest from 2241 kg ha-1(G8) at Chefe-2020 to the highest 3093 kg ha-1 (G4) at Minjar-2020. Among the tested genotypes, G4 was the top yielder at four environments (Minjar 2019 & 2020, Ginchi 2019). Overall, the genotype code G4 (candidate variety), although it is not in the entire tested environment, performed better than others, at least it is a high yielder at four environments. The huge variability in the grain yield among the 20 tef genotypes at the six environments might be due to wide variability in climatic and soil conditions. This finding is following the previous studies [9, 24, 30, 31] that similarly reported which thereby complicates the selection and recommendations stable genotype across the environment.Significant G × E effects observed in the present study indicate that the genotypes evaluated do not show consistent performance across test environments. This allows for an investigation of the nature and magnitude of G × E, which cannot be achieved by a standard analysis of variance. The significant GEI in the present study indicates the unstable performance of the tef genotypes across the testing environments (Figure 3). Thus, it implied that the genotypes respond differently across the different environments. In genotype x environment interaction (GEI) the result exhibited the genotypes gave statistically higher grain yield (10.13%) than the standard check variety. In addition to this considering the current tef grain price, 46 Birrkg-1 there was an economically meaningful difference among tested genotypes. Therefore, one promising candidate variety, Genotype Code G4 gave grain yield 2827 kg ha-1 compared to the standard check variety Negus depicting grain yield 2567 kg ha-1. Therefore, genotype Code G4 has been recommended for a variety verification trial to be evaluated by the National Variety Release Technical Committee (NVRTC) and released as a new commercial variety after NVRTC confirms it.
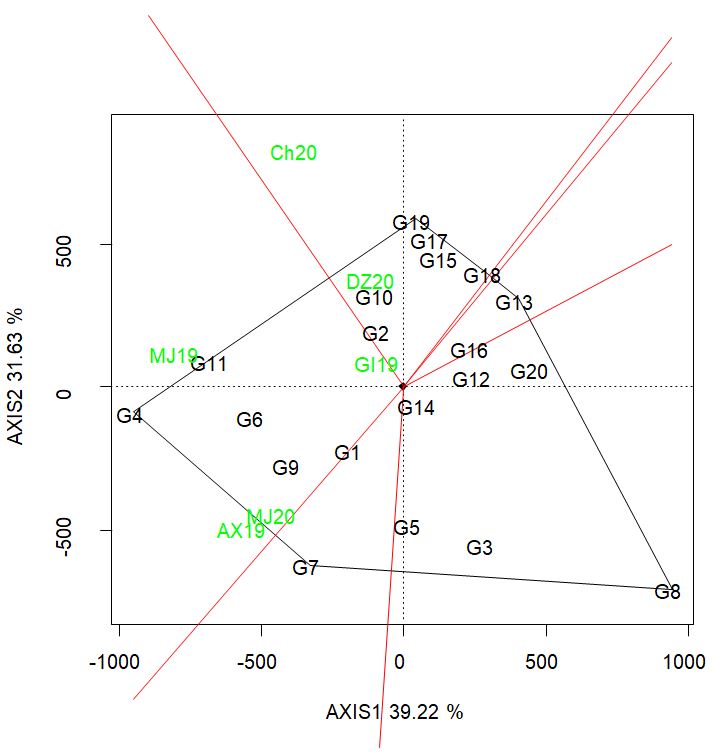
GGE biplot analysis provides a graphical representation of the relationships between genotypes and environments and can effectively reveal genotype performance and stability [26, 29]. The visualization of a 'which won where' pattern in multi-environment trials is essential to study the adaptability of genotypes in the specific or across all test environments [28]. The vertex genotypes were the most responsive for being located at the greatest distance from the biplot origin. The genotypes with either the best or poorest performance in one or all environments were considered responsive [28] falling within the sectors. The GGE biplots of graph results were used to show the relative performance of all genotypes at a specific environment (Figure 1) falling within the sectors. The GGE biplots of graph results were used to show the relative performance of all genotypes at a specific environment (Figure 1).
Stability Analysis
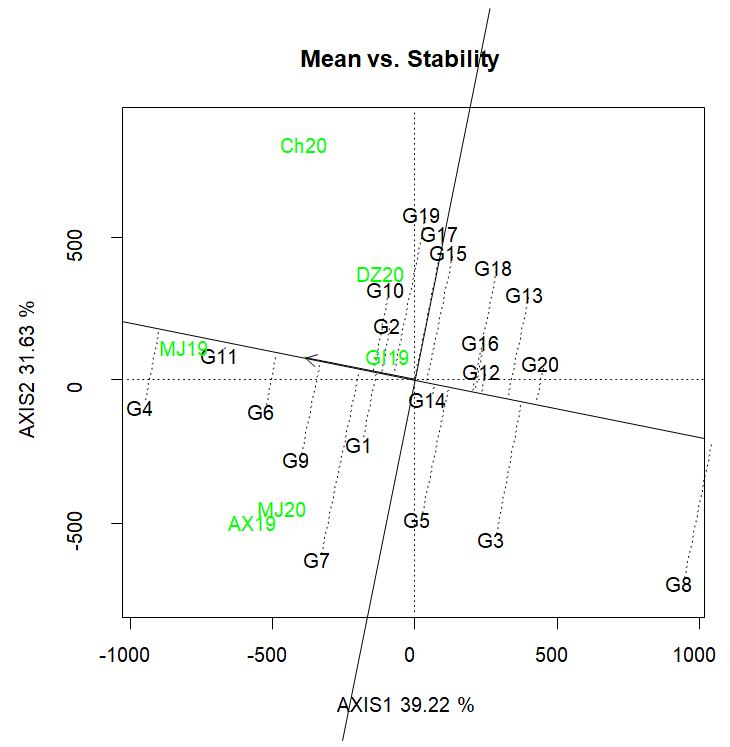
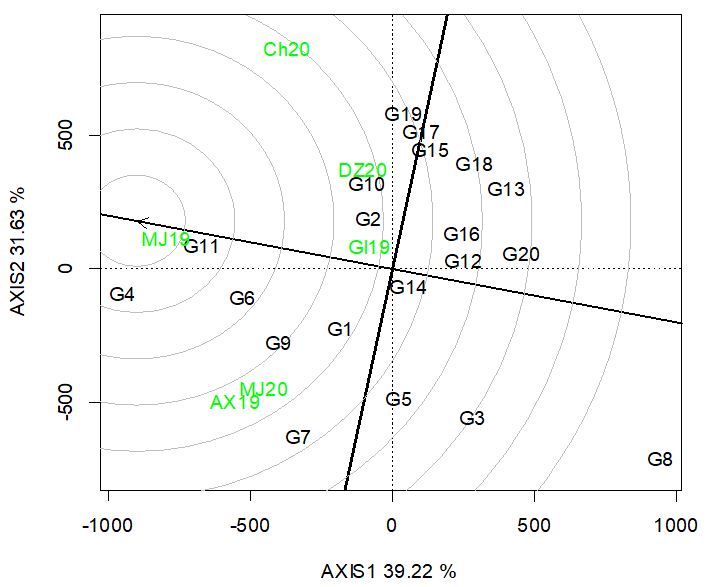
An ideal genotype is the one that shows the highest mean performance and is highly stable across all test environments [20, 22, 23, 30]. Based on the average-environment coordination (AEC) view comparison biplot, an ideal genotype is associated with greatest vector length of the high-yielding genotypes, and a desirable genotype is the one that is located closer to an ideal genotype, which is usually at the center of the concentric circles.
In the average environmental coordinate (AEC) system, the AEC X-axis (PC1) passes through the biplot origin with an arrow indicating the positive end of the axis and indicates the mean performance axis of genotypes. The ATC Y-axis passes through the biplot origin and is perpendicular to the ATC X-axis. This axis indicates the stability axis (PC2) (Figure 2). Based on these, statistically, the stable genotypes are located near the AEC X-axis (PC1) with PC2 scores of almost zero. According to Figures 2 and 3, genotype codes G11, G6, and G4 were the most stable genotypes. The genotype code G8, G20, G13, G3, and others were less stable because of the high PC2 values and they were adapted for specific environments. Concerning the total environment, stability and high yield should be considered together when making the selection. Because G11, G6, and G4 genotypes were closest to zero in respect to PC2, these genotypes were more stable with an above-average yield. Therefore, the genotype with stable and high yield can be considered as a commercial for the high potential tef growing region in Ethiopia. In addition to the GGE biplot graph, genotype superiority with the small measured coefficient value indicates the more stable genotypes (Table 3). Therefore, from the present study, genotype code G4 /RIL No. 173/ was the most stable and high yielder, and genotype code G4 / RIL No. 242/was the most unstable and low yielder genotypes, respectively. This result is similar to the previous studies [4, 31].
Conclusion and Recommendation
The results of AMMI analyses indicated that tef grain yield performances were highly affected by the environmental effect followed by the magnitude of GEI and genotype contributed the least effect. The AMMI and GGE biplot analysis permitted estimation of the interaction effect of a genotype in each environment and it helped to identify genotypes best suited for specific environments. GGE biplot analysis showed that the polygon view of a biplot is the best way to visualize the interaction models between genotypes and environments. According to the AMMI and GGE biplot, considering simultaneous average yield and stability, G4 and G11 genotypes were the best genotypes across all tested environments. Therefore, Genotype code G4 (HO-TF-1486 x DZ-01-2787(RIL No. 173)) should be used as a commercial variety for potential tef growing areas to increase tef productivity and production in the country after the NVRC approves it in the variety verification trial.
- Alemayhu Balcha (2020) Additive Main Effects and Multiplicative Interaction and Other Stability Analyses of Tef [Eragrostis tef (Zucc.)Trotter] Grain Yield. Am J Plant Sci 11: 793-802.
- Central Statistical Agency Agricultural Sample Survey 2019/20 (2012 E.C.) Volume I Report On Area and Production of Major Crops, Statistical Bulletin 587, Addis Ababa, Ethiopia.
- Chanyalew S, Ferede S, Damte T, Fikre F, Genet Y, et al. (2019) Significance and prospects of an orphan crop tef. Planta, an Int J Biol 250: 753-67.
- Chekole Nigus, Yanos G/Mariam, Hailegbrea Kinfe, Brhanu Melese, Ataklty Mekonen (2020) Grain yield performance and parametric stability statistics of Tef {Eragrostis Tef (zucc) trotter} genotypes in Tigray, Ethiopia. Agric Sci 2: 2690-4799.
- D’Andrea AC (2008) Tef (Eragrostis tef) in ancient agricultural systems of highland Ethiopia. Econ Bot 62: 547- 66.
- Dewi AK, Chozin MA, Triwidodo H, Aswidinnoor H (2014) Genotype x environment interaction and stability analysis in lowland rice promising genotypes. Int J Agron and Agric Res 5: 74-84.
- Falconer DS, Mackey TFC (1996) Introduction to Quantitative Genetics, 4th Edn. Harlow: Addison-Wesley Longman.
- Frutos E, Galindo MP, Leiva V (2015) An interactive biplot implementation in R for modeling genotype-by-environment interaction. Stochastic Environmental Research and Risk Assessment 28: 1629-41.
- Habte Jifar, Kebebew Assefa, Kassahun Tesfaye, Zerihun Tadele (2019) Genotype x environment interaction and stability analysis in grain yield of tef (Eragrostis tef) evaluated in Ethiopia. JEAI 35: 1-13.
- Gabriel KR (1971) The Biplot Graphic Display of Matrices with Application to Principal Component Analysis. Biometrika 58: 453-67.
- Gauch HG (2013) A simple protocol for AMMI analysis of yield trials. Crop Sci 53: 1860-9.
- Giridhar K, Surya Kumari S, Sarada C, Naram NL (2016). Stability for Seed Yield in Ajwain based on Genotype Selection Index. Indian J Agric Res 50: 244-8.
- Gollob HF (1968) A statistical model which combines features of factor analytic and analysis of variance techniques. Psychometrika 33: 73-115.
- Kang MS (1998) Using genotype-by-environment interaction for crop cultivar development. Adv Agron 62: 199-252.
- Lotan Kumar Bose, Nitiprasad Namdeorao Jambhulkar, Kanailal Pande, Onkar Nath Singh (2014) Use of AMMI and other stability statistics in the simultaneous selection of rice genotypes for yield and stability under direct-seeded conditions. Chilean J Agric Res 74: 1.
- Matthew Davidson J (2018) Evaluating tef Grass as a Summer Forage; College of Agriculture Manhattan: Kansas, NY, USA.
Mohammadi R, A Abdulahi, R Haghparast, M Armion (2007) Interpreting genotype-environment interactions for durum wheat grain yields using non-parametric methods. Euphytica 157: 239-51. - Munawar M, Hammad G, Shahbaz (2013) Evaluation of maize (Zea mays L.) hybrids under different environments by GGE biplot analysis. Am-Eurasian J Agric Environ Sci 13: 1252-7.
- Oliveira RLD, Von Pinho RG, Balestre M, Ferreira DV (2010) Evaluation of maize hybrids and environmental stratification by the methods AMMI and GGE biplot. Crop Breed Appl Biot 10: 247-53.
- Oral E, Kendal E, Dogan Y (2018) Selection the best barley genotypes to multi and special environments by AMMI and GGE biplot models. Fresenius Environmental Bulletin 27: 5179-5187.
- SAS Institute (2002) SAS/STAT Guide for Personal Computers, Version 9.00 editions. Cary, N.C., SAS Institute Inc.
- Sharifi P, Hashem A, Rahman E, Ali M, Abouzar A (2017) Evaluation of Genotype × Environment Interaction in Rice Based on AMMI Model in Iran. Rice Sci 24: 173-80.
Spaenij-Dekking L, Kooy-Winkelaar Y, Koning F (2005) The Ethiopian cereal tef in celiac disease. New England J Med 353: 1748-9. - Tsion Fikre, Kebebew Assefa and Kassahun Tesfaye. 2020. Extent and pattern of genetic diversity for phenol-agro morphological traits in Ethiopian improved and selected farmers' varieties of Tef (Eragrostis tef (Zucc.) Trotter). Afr J Agric Res 16: 892- 901.
- Worku Kebede, Yazachew Genet, Tsion Fikre, Kidist Tolosa, Solomon Chanyalew (2020) Tef (Eragrostis tef) variety development for moisture stress areas of Ethiopia. Journal of Innovative Agric 7: 1-6.
- Yan W (2001) GGE Biplot – a Windows application for graphical analysis of multi-environment trial data and other types of two-way data. Agron J 93: 1111-8.
- Yan W, Hunt LA, Sheng Q, Szlavnics Z (2000) Cultivar evaluation and Mega environment investigation based on the GGE biplot. Crop Sci 40: 597-605.
- Yan W, NA Tinker (2006) Biplot analysis of multi-environment trial data: Principles and applications. Can. J. Plant Sci 86: 623-45.
- Yan W, Manjit S Kang, Baoluo Ma, Sheila Woods, Paul L Cornelius (2007) GGE Biplot vs. AMMI Analysis of Genotype-by-Environment Data. Crop Sci 47: 641-53.
- Yazachew Genet, Tsion Fikre, Kebebew Assefa, Solomon Chanyalew, Worku Kebede (2020) Tef (Eragrostis tef) Recombinant Inbred Line Variety Development for High Potential Areas of Ethiopia. Plant 8: 93-9.
- Yazachew Genet, Tsion Fikre, Worku Kebede, Solomon Chanyalew, Kidist Tolosa, et al. (2020) Performance of Selected Tef Genotype for High Potential Areas of Ethiopia. Ecol and Evol Biol 5: 35-42.