Biology (SPBR)
Stechnolock: Plant Biology and Research
Full Text
Volume 1, Issue 1
Assessment of Indian Durum Wheat under Terminal Heat Stress
*Corresponding Author: Gautam A, Associate Scientist, International Center for Agricultural Research in the Dry Areas (ICARDA) (ICARDA), India, Tel: +91-7987312023, E-mail: amit_gomsi@yahoo.com
doi: /spbr.2021.1.105
Citation: Gautam A, SaiPrasad SV, Phuke RM (2021) Assessment of Indian Durum Wheat under Terminal Heat Stress. Stechnolock Plant Biol Res 1:1-16
Copyright: © 2021 Gautam A. This is an open-access article distributed under the terms of Creative Commons Attribution License, which permits unrestricted use, distribution, and reproduction in any medium, provided the original author and source are credited.

Abstract
In India, Durum wheat is cultivated in more than 1 million hectares among central and peninsular regions, where the effect of heat stress is prominent especially during the grain filling period i.e., at the terminal stage of the plant growth effecting the crop yield drastically. To evaluate the stability and performance of durum wheat under late sown conditions, a field study was conducted for three seasons i.e., 2010-2011, 2011-12 and 2012-13 respectively, at Indian Agricultural Research Institute, Regional Station, Indore (Madhya Pradesh) India, involving 102 durum wheat genotypes at two sowing dates i.e., late sowing (7th December) and very late sowing (25th December) every year. Each genotype was sown in two rows of 2.5 m length each with a row to row spacing of 18 cm in randomized block design in three replications. The stability performance analysed using AMMI biplots and Biplot analysis have ranked G 40 (HI 8498), G 63 (MACS 9), G 77 (N 59) and G 90 ( RAJ 6516) as most stable genotypes for grain yield similarly G 69 (MACS 3125) and 99 (WH 896) were identified as high yield genotypes but suitable for specific conditions under late heat stress. G 41 (HI 8550), G 47 (HI 8653), G 71 (Mandsour Local) and G 78 (NI 5759) were found to be best stable genotypes for high number of tillers under all the environments; for stable low canopy temperature under pre anthesis stage both model explains that the genotypes G 62 (Line 1172), G 65 (MACS 2694), G 67 (MACS 3061) and G 76 (MPO 1215 having low canopy temperature and were highly stable for all the environments. GGE and AMMI biplot ranked G 26 (GW 1139), G 27 (GW 1170), G 28 (GW 1209) and G 77 (N 59) as best stable genotypes for thousand kernel weight. As, Indian durum wheat is comparable with its Canadian and Australian counterparts in terms of quality for processing, and hence, multi-national food companies doing business in India are planning to utilize it rather than depending on the imports. This study showed that the genotypes tolerant to post-anthesis high temperature stress and short growing period can be best suited to the late sown conditions of India increasing the scope for durum wheat production under late sown and terminal heat stress conditions in India.
Keywords:Durum Wheat; Heat Stress; Late Sown and Stability; GGE; AMMI Biplot
List of abbreviations: AMMI: Additive Main Effects and Multiplicative Interaction; GGE: Genotype Main Effects and Genotype × Environment Interaction Effects; GY: Grain Yield; TGW: Test Grain Weight; RBD: Randomize Block Design
Introduction
Global climate change and global warming in particular has started to show its impact on crop production. Heat stress is one of the major abiotic stresses that limits plant growth and development by affecting its photosynthetic capacity [1], metabolic activity [2,3], by promoting the production of oxidative reactive species [2], reducing pollen tube development and causes pollen mortality [4], by encouraging ethylene production, thus increasing grain abortion [5] and causes oxidative damage to the chloroplast which finally affects the grain yield [3]. Heat stress is more detrimental especially when it occurs at reproductive and grain filling stages [3,5].
The worldwide productivity of wheat was 3.32 ton/ha in 2015, 3.42 tonton/ha in 2016, 3.54 ton/ha in 2017 and 3.43 ton/ha in 2018 whereas Nepal had productivity of wheat 2.59 ton/ha in 2015, 2.33 ton/ha in 2016, 2.55 ton/ha in 2017 and 2.76 ton/ha in 2018 [6].
Wheat is one of the most sensitive crops which is effected by many abiotic stress including heat stress especially at the time of grain filling and it is estimated that rise in temperature by 1oC may lead to yield losses between 3–17% (average 11%) in many Asian countries including India and Pakistan [7]. Among wheat species durum wheat is one of most important wheat species which serves as the raw material for numerous foods such as macaroni, pasta products and semolina in the nourishment of world population, and in India for many local products like bafla, suji and dalia etc. [8]. It possesses harder kernel, considerably higher yellow pigment content and relatively higher grain protein content than common wheat (Triticum aestivum L.). Durum wheat generally has inextensible gluten and therefore, most of the durum wheat produced worldwide is milled into semolina to make compact and stiff dough to manufacture pasta products. Durum wheat (Triticum turgidum L. ssp. durum) is cultivated in many countries, the Mediterranean Basin, North America and South Asia including India [9]. In India durum wheat is cultivated mostly in central and peninsular regions where effect of heat stress is prominent especially during the grain filling period i.e., at the terminal stage of the plant growth [10]. High temperature stress at the end of growing season of wheat crop usually constrain crop yield potential as this stress coincides with the grain filling period in these regions, so it has become an integral part of the crop improvement activities of breeders at the national and international level to improve heat stress tolerant durum wheat genotypes, which helps not only in increasing area under durum wheat cultivation in non-traditional areas, but will also optimize the durum wheat yield in traditional cultivation under multiple cropping systems [11-13]. Improving yield, quality and stress resistance are the main objectives of the entire breeding programme. Yield and its components in stress condition, are still the most effective tools for stress evaluation. Therefore understanding parameters that can judge heat stress tolerance and development of heat tolerant wheat cultivars are of paramount importance. Genetic diversity for heat tolerance in wheat is well established [14,15]. Many physiological traits were used for the screening of heat tolerance genotypes such as canopy temperature, stomatal activities and many more. Several statistical methods like Stability variance [16,17]; environmental variances [18]; coefficient of variability [19]; superiority measure of genotypic performance and multivariate AMMI [20, 21]; GGE biplot [22] statistical models are available to quantify the G × E interaction. The assessment of stability of the durum wheat genotypes for grain yield and other yield contributing traits under heat stress conditions is important to select the reliable durum wheat genotypes for breeding heat stress tolerant high grain yielding cultivars. Thus, the focus should be given to increase productivity by breaking the yield barrier through genetics and breeding tools, and mitigation of biotic and abiotic stress to wheat production [23,24]. The present investigation aimed to evaluate stable performance of different yield contributing and physiological parameters under terminal heat stress conditions.
Materials and Methods
Genetic material
Set of one hundred and two genetically diverse durum wheat genotypes (Table 1) were selected from the germplasm of ICAR-Indian Agriculture Research Institute, Regional Station, Indore, India based on their earlier performance under various environmental conditions.
Field evaluation
A field study was carried out during three rabi seasons i.e., 2010-2011, 2011-12 and 2012-2013 at ICAR-Indian Agricultural Research Institute, Regional Station, Indore (M.P) India. The experimental field is situated between 22°37′ N latitude to 75°50′ E longitude at 557 m above MSL having semi-arid and humid climate with a temperature range of 23°C to 41°C and 7°C to 29°C in summer and winter seasons, respectively. In this area, most of the rainfall is received during south-west monsoon, i.e., between June to September, with occasional showers in winter. The experimental material involved 102 durum wheat genotypes sown at two sowing dates: late (7th Dec.) and very late (25th Dec.) for three wheat growing seasons, providing us the data for six environments. Sowing was done in beds having length of 2.5 m in two row plots with a row to row spacing of 18 cm in RBD with three replications for each sowing. Four irrigations were given during the crop cycle i.e., second between thirty to forty days (vegetative stage), fifty five to sixty days from the date of sowing (heading time), eighty to ninety days from date of sowing and at milking stage. Recommended agronomical practices were followed to raise the good crop and care was taken to minimize any variations due to environmental and cultural conditions. During the crop growth, the days to heading was recorded according to the [25]. Canopy temperature was measured six times i.e., 3 times from vegetative stage to anthesis and 3 times after post anthesis stage to grain filling stage, at the time interval of eight days. Parameters like number of tillers per plant, 1000 grain weight and yield per plant were recorded for further analysis.
Descriptive Statistics
Mean, range, correlation of grain yield and different yield contributing traits of both the environments were computed in the pooled form using Genstat release 16.1 [26].
Additive main effects and multiplicative interactions (AMMI) model
Magnitude of genotype, environment and genotype × environment (G × E) interaction was assessed by ANOVA using the AMMI mode [27] by keeping genotype in fixed and environment in random effects. AMMI was performed by Genstat release 16.1, [26].
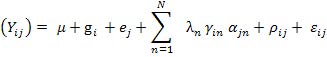
The AMMI model for G genotypes and E environments is as
Where, Yij = target trait response of ith genotype (i = 1, 2,. . ., I) in jth environment j (j = 1, 2,. . ., J); μ = is the general mean; gi = main effect associated to the ith genotype; ej = main effect associated to the jth environment; N = max (G-1, E-1) i.e., the number of principal axes (principal components) retained in the model to describe the pattern of the interaction between the ith genotype with the jth environment; λn = singular value of the nth principal interaction axis; γin = ith element of the singular column vector associated to axis n; αjn is the jth element of the singular row vector associated to axis n; ρij is the AMMI residue; and εij = pooled error.
GGE biplot model
GGE biplot [28,29] was constructed using entry means from each environment for kernel micronutrients concentration and grain yield using Genstat release 16.1 software [26].
GGE biplots using following mathematical model

Where, Yij = average yield of ith genotype in jth environment, = average yield over all genotypes in jth environment and λ1ξi1ηj1 and λ2ξi2ηj2 = collectively the first and second principal component (PC1 and PC2); λ1 and λ2 = singular values for the first and second principal components, PC1 and PC2, respectively; ξi1 and ξi2 = PC1 and PC2 scores, respectively for the ith genotype; ηj1 and ηj2 = PC1 and PC2 scores, respectively for jth environment; and eij = residual of the model associated with the ith genotype in the jth environment.
Results
The data of grain yield and other traits for the one hundred two durum wheat genotypes was pooled across six environments (three late and three very late sown conditions). The mean, range, heritability and standard error for studied traits summarised in Table 2. The mean grain yield/plant and 1000 grain weight were 16.8 g and 44.8 g. The mean canopy temperatures during pre and post anthesis were 20.3 ºC and 24.6 ºC. Similarly days to flowering and number of tillers per plant were 73.0 days and 9.5 respectively. High broad sense heritability was observed in grain yield per plant (97.9 %) followed by days to flowering (97.8 %), 1000 grain weight (96.8 %) and canopy temperature at pre-anthesis stage (96.2 %). Genetic advance over mean was observed highest in grain yield per plant (43.6%) followed by number of tillers per plant (38.5 %), 1000 grain weight (29.2 %) and days to flowering (13.8 %).
Descriptive statistical analysis of grain yield and its contributing components in the pooled data presented in Table 3 showed that highest grain yield per plant (20.4 g) and number of tillers per plants (11.1) were found in year 2010-11 under late sown conditions whereas, lowest grain yield per plant (12.5 g), days to flowering (67.6) and number of tillers/plant (8.2) were found in year 2012-13 under very late sown conditions. Highest thousand grain weight (49.1g) was found in the year 2012-13 under late sown conditions and the lowest (38.8 g) in the year 2011-12 under very late sown conditions, whereas Lowest canopy temperature under pre anthesis and post anthesis were found in years 2010-11 very late sown conditions (19.1 °C) and 2012-13 (24.0 °C) under late sown conditions respectively.
Combined AMMI-ANOVA for grain yield and contributing traits
AMMI-ANOVA was performed for grain yield and yield contributing traits to know the contribution of genotype, environment and G × E interaction (GEI) component to the observed total variation. AMMI-ANOVA for grain yield and other traits showed significant contribution (p < 0.01) of main effects due to genotype, G × E interaction and environment components (Table 4) In the present investigation the significant variation among the six test environments showed that the test conditions have provided the variability for expression of each trait under study. The large GEI results in to different genetic nature of genotypes and control the diverse processes bringing in the yield stability under different environments. Since GEI was significant, we therefore move further to estimate stability by AMMI and GGE biplot models to identify the most stable genotype in different environments and attribute special genotypes to special environments. Major portion of variation was contributed by environment effect for canopy temperature at pre-anthesis stage (51.1 %) and grain yield per plant (45.1 %). On the other hand genotypic effects was major for days to flowering (48.7%) and 1000 grain weight (36.1%) whereas, G × E interaction effect for canopy temperature at post-anthesis stage (53.0 %), and number of tillers per plant (42.4%) was found to be high.
The first three principle components of G × E were highly significant for all the traits. IPCA1 and IPCA2 explained the maximum portion of interaction effects ranging from 13.4 % to 62.4% in canopy temperature (post anthesis). Significant contribution of IPCA1 and IPCA2 towards GEI for grain yield and yield contributing traits confirmed the adequacy of the AMMI model, and therefore, respective biplots construction was justified (Table 3).
Stability analysis for grain yield and other trait by AMMI biplot analysis
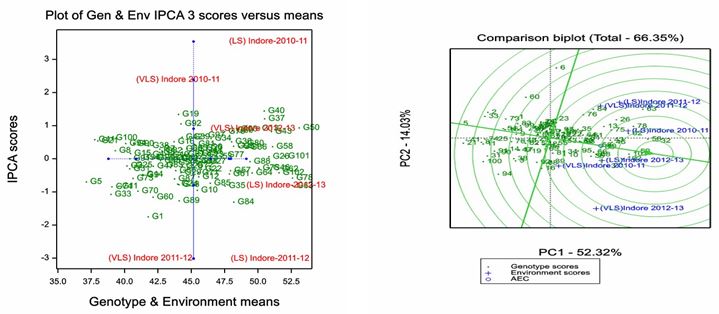
Biplot is the most powerful interpretive tool for AMMI model. We plotted a biplot where the main effects (genotype mean and environment mean) and IPCA scores of both environments and genotypes are plotted against each other.
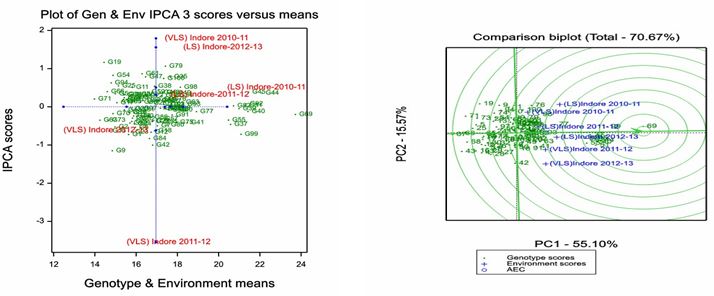
Grain yield: IPCA 1 of AMMI biplot for grain yield per plant accounted 40.4% of G × E interaction and 11.0% of the total variation (Table 4). The distribution of the environments in the biplot with variable environment means and IPCA scores indicate that the environments behaved very distinct compared each other and selecting of the adaptable and high yielding genotypes among these environments will be useful for late heat stress in durum wheat. Among the environments, late sown (2011-12) was found to be the favorable location for the study as it showed average mean yield and near zero IPCA score.
AMMI biplot placed genotypes G 39 (HI 8381), G 40 (HI 8498), G 63 (MACS 9), G 77 (N 59), G 82 (NIDW 295) and G 93 (Sarangpur Local) on the IPCA zero line or close to the zero line and high mean yield suggested their suitability for grain yield under both late and very late sown conditions. As the IPCA score is zero or near to zero, indicates that the GEI effect is less and are less effected by the environment making these genotypes most adaptable, Whereas, genotypes G 37 (HG 110), G 44 (HI 8627), G 45 (HI 8638), G 55 (IWP 5013), G 69 (MACS 3125) and G 99 (WH 896) which are having high mean yield but with positive IPCA scores indicate that these genotypes were adapted to specific environment for this traits (Figure 1A).
Days to flowering
For days to flowering, AMMI biplot analysis between the mean values and the mean of IPCA scores (Figure 2A) indicated that there is no much distinct behavior among the environments. IPCA1 for days to flowering accounted to 33.1% of G × E interaction and 5.4% of the total variation (Table 4). AMMI biplot placed genotypes G 50 (HI 8671), G 64 (MACS 1967), G 77 (N 59), G 82 (NIDW 295), G 83 (NP 4) and G 98 (VIJAY) on the IPC1 zero line or close to the zero line along with early flowering suggested their stability across late sown conditions. Several genotypes like G 25 (GW 1114), G 30 (GW 1240), G 32 (GW 1245), G 56 (IWP 5070), G 60 (Karnataka Local), G 69 (MACS 3125) and G 92 (RAJ 6566) were found to be early flowering but were placed away from the IPCA1 zero line revealed that they adapted to specific environment.
Number of tillers per plant
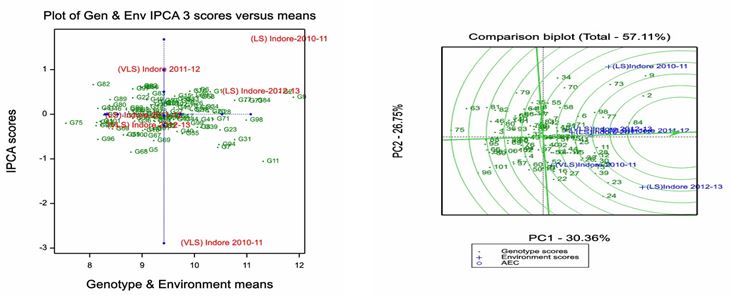
AMMI biplot analysis for number of tillers (Figure 3A) indicated that late sown (2011-12) was the best environment for evaluation of the genotypes. The environments plotted on the biplot showed their distinct behavior making the selection of high tillering genotypes in this experiment justified. IPCA1 for number of tillers per plant accounted 36.1% of G × E interaction and 15.3% of the total variation (Table 3). AMMI 1 biplot placed genotypes G 20 (DW 137), G 27 (GW 1170), G 28 (GW 1209), G 41 (HI 8550), G 47 (HI 8653), G 71 (Mandsour Local), G 77 (N 59), G 78 (NI 5759) G 84 (NP 404) on the IPC1 zero line or closed to the zero line and with more number of tillers indicating their stability for late sown conditions. Whereas genotypes like G 1 (A 9-30-1), G 2 (A 206), G 7 (B 4446-WA), G 9 (Bansi Local), G 23 (GW 1), G 31 (GW 1244) and G 94 (Sawer Local) with more number of tillers found away from the IPC1 zero line revealed that they adapted to specific environment for this traits.
Canopy temperature pre anthesis stage
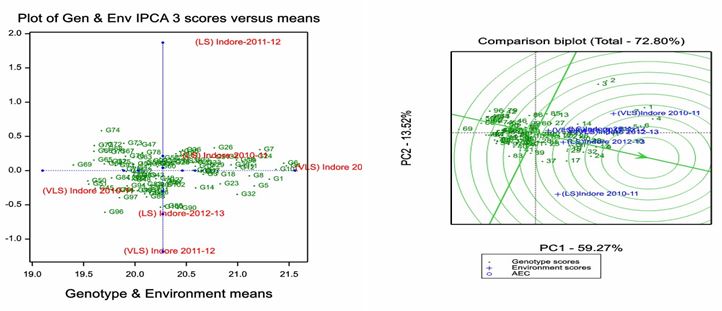
IPC1 of AMMI biplot for canopy temperature at pre-anthesis stage accounted 44.0% of G × E interaction (Table 3). AMMI 1 biplots placed genotypes G 42 (HI 8591), G 62 (LINE 1172), G 65 (MACS 2694), G 69 (MACS 3125) and G 76 (MPO 1215) on the IPC1 zero line or closed to the zero line suggesting their suitability for general adaptation. Whereas genotypes G 45 (HI 8638), G 72 (MEGHDOOT), G 74 (MPO 215), G 77 (N 59) and G 97 (VD 97-15) with low canopy temperature at pre anthesis and away from the IPC1 zero line revealed that they adapted to specific environment (Figure 4A).
Canopy temperature at post anthesis stage
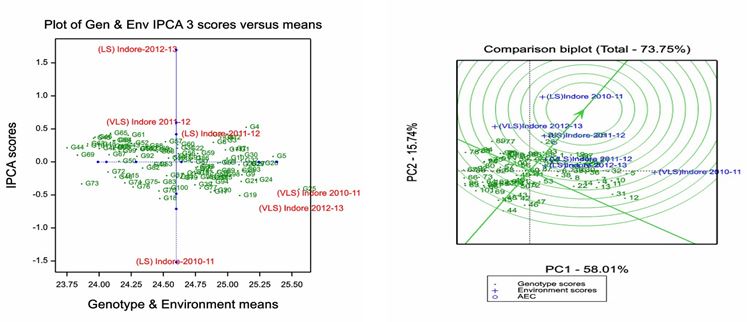
IPC1 of AMMI biplot for canopy temperature at post anthesis stage accounted 62.5% of G × E interaction and 33.1% of the total variation (Table 3). AMMI 1 biplots placed genotypes G 48 (HI 8663), G 50 (HI 8671), G 53 (IWP 5004-1), G 67 (MACS 3061), G 69 (MASC 3125), G 82 (NIDW 295) and G 92 (RAJ 6566) on the IPC1 zero line or closed to the zero line suggesting their suitability for general adaptation. Whereas genotypes like G 44 (HI 8627), G 52 (HI 8722), G 61 (Kathia 25), G 65 (MACS 2964), G 73 (Motia), G 74 (MPO 215), G 75 (MPO 1106) and G 77 (N 59) with low canopy temperature at post anthesis and away from the IPC1 zero line revealed that they adapted to specific environment for this traits (Figure 5A).
1000 grain weight
IPCA1 of AMMI ANOVA for 1000 grain weight accounted for 33.6% of G × E interaction and 9.0% of the total variation (Table 3). AMMI 1 biplots placed genotypes G 23 (GW 1), G 26 (GW 1139), G 27 (GW 1170), G 28 (GW 1209), G 53 (IWP 5004-1), G 77 (N 59), G 88 (RAJ 1555) on the IPC1 zero line or closed to the zero line and with high 1000 grain weight showing their adaptability across the various environments. Whereas genotypes G 35 (HD 4676), G 37 (HG 110), G 40 (HI 8498), G 43 (HI 8592), G 50 (HI 8671), G 78 (NI 5759), G 84 (NP 404), G 102 (V 21) with 1000 grain weight found away from the IPCA1 zero line revealed that they adapted to specific environment for this traits (Figure 6A).
GGE biplot: Identification of stable genotype for grain yield and other traits
GGE biplots were generated to analyze the stability of grain yield and other yield contributing traits under pooled analysis of six environments (Figures 1B to 6B). For yield and yield contributing traits, principle component axes explained 57.11 to 80.61% of the G + G × E interaction variation (days to flowering 80.61%; number of tillers per plant: 57.11%; canopy temperature pre-anthesis and post-anthesis: 72.80% and 73.75% respectively; 1000 grain weight: 66.35% and grain yield per plant 70.67%). GGE biplots for grain yield and other traits revealed that the environments under study behaved distinctly making the plotting of biplots justified.
Grain yield per plant
GGE biplot was also employed by using PCA 1 and PCA 2 to ascertain environmental variation and to interpret the genotype-environment interactions, here PCA 1 score is 55.10 % and PAC 2 is 15.5 % (Figure 1B). The ideal test environment for the expression of the trait under the study is depicted theoretically in the center of the concentric circles and characterized as fully representative when it has zero distance from the horizontal axis and giving the maximum discrimination among the cultivar when its vector is the longest. The environment late sown 2012-13 was most representative environment for grain yield per plant.
According to the GGE biplot, the ideal genotype must have a high PC1 value (high mean productivity) and a PC2 value near zero (high stability). Based on the graphical interpretation, genotypes G 69 (MACS 3125) followed by G 99 (WH 896) and G 39 (HI 8381) were found as most ideal genotype for grain yield per plant and G 51 (HI 8691) followed by G 55 (IWP 5013) and G 46 (HI 8645) were of high yield but unstable for this trait.
Days to flowering
In the GGE biplot for days to flowering, PCA 1 score is 71.30 % and PAC 2 is 9.31 % (Figure 2B). The experimental data showed that late sown 2012-13 which is close to the ideal environment was the best among six environments for testing days to flowering. Thus, based on the graphical interpretation, genotypes G 56 (IWP 5070) followed by G 98 (VIJAY), G 68 (MACS 3063) were found to be most ideal genotype as they are early flowering and stable, whereas G 58 (Jay) followed by G77 (N 59), G 63 (MACS 9) were also of early flowering but unstable for this trait.
Number of tillers per plant
The biplot for number of tillers per plant showed the PCA 1 score as 30.36 % and PAC 2 as 26.75 % (Figure 3B). The very late sown 2011-12 appears to be the most representative environment for expression of this trait. As the ideal genotype will be stand near to AEC (absolutely stable) in positive direction, the graphical interpretation shows genotypes viz.,G 84 (NP 404) followed by G 11 (Bijaga Red), G 12 (Bijaga Yellow) and G 28 (GW 1225) were found as most ideal genotype for number of tillers per plant and G 9 (Bansi Local) followed by G 2 (A 206), G 77 (N 59) and G 98 (Vijay) were of more number of tillers but unstable for this trait.
Canopy temperature pre and post anthesis stage
IPCA 1 score of biplot plotted for pre anthesis and post anthesis stages are 59.27 % & 58.01 % and IPAC 2 is 13.5 % & 15.74 % respectively (Figures 4B and 5B). The late sown 2012-13 was most representative environment for canopy temperature at pre anthesis, whereas late sown 2010-11 and very late sown 2010-11 were unstable. For canopy temperature at post anthesis late sown 2010-11 was the most desirable environment. Based on the graphical interpretation, genotypes G 84 (NP 404) followed by G 50 (HI 8691), G 66 (MACS 2846) and G 62 (Line 1172) were found most ideal genotype for canopy temperature at pre-anthesis stage and G 69 (MACS 3125) followed by G 96 (V 21/23) and G 73 (Motia) were having low canopy temperature but unstable for this trait. For canopy temperature at post anthesis stage genotypes like G 45 (HI 8638) followed by G 48 (HI 8663) and G 43 (HI 8592) were found to be most ideal and stable, whereas G 42 (HI 8591) followed by G 69 (MACS 3125), G 44 (HI 8627) and G 47 (HI 8653) were unstable genotypes.
Thousand grain weight
The comparison biplot of 1000 grain weight showed the IPCA 1 score of 52.32 % & IPAC 2 of 14.03 % (Figure 5A). The environment late sown 2012-13 was most representative environment. Based on the graphical interpretation, genotypes G 50 (HI 8671) followed by G 101 (MPO 1243) and G 32 (GW 1245) were found as most ideal genotype for 1000 grain weight and G 37 (HG 110) followed by G 56 (IWP 5070), G 62 (Line 1172) and G 46 (HI 8645) were of more number of tillers but unstable for this trait.
Comparison of stability models
Two stability models were compared for their efficiency based on the yield and yield contributing traits under pooled analysis. The best genotypes identified by both the stability models for the traits under study were almost similar.
The two stability models identified G 40 (HI 8498), G 63 (MACS 9), G 77 (N 59) and G 90 ( RAJ 6516) as most stable genotypes for grain yield similarly G 69 (MACS 3125) and 99 (WH 896) were identified as high yield genotypes but suitable for specific conditions under late heat stress.
For stability of days to flowering both AMMI and GGE biplots ranked G 50 (HI 8671), G 77 (N 59), G 82 (NIDW 295) and G 83 (NP 4) as best stable genotypes for early flowering time under for all the environments. Similarly G 56 (IWP 5070), G 60 (Karnataka Local) and G 69 (MACS 3125) were also grouped by these both the model as high yielding genotypes but not very stable over the environments.
Both AMMI and GGE bi plot analysis genotypes showed G 41 (HI 8550), G 47 (HI 8653), G 71 (Mandsour Local) and G 78 (NI 5759) as best stable genotypes for high number of tillers under all the environments; in the same way the genotypes G 2 (A 206), G 7 (B 4448-WA), G9 (Bansi Local), G 23 (GW 1) and G 94 (Sawer Local) were also classified as genotypes having more number of tillers per plant but unstable; for stable low canopy temperature under pre anthesis stage both model explains that the genotypes G 62 (Line 1172), G 65 (MACS 2694), G 67 (MACS 3061) and G 76 (MPO 1215 having low canopy temperature and were highly stable for all the environments similarly, genotypes G 72 (MEGHDOOT), G 74 (MPO 215), G 77 (N 59) and G 97 (VD 97-15) were also of low canopy temperature but unstable genotypes; Genotypes G 50 (HI 8671), G 67 (MACS 3061) and G 82 (NIDW 295) were grouped for low canopy temperature and stable genotypes for all the environments under post anthesis stage of plant growth, similarly genotypes G 44 (HI 8627), G 75 (MPO 1106) and G 77 (N 59) were also grouped for low canopy temperature under post anthesis stage but suitable for specific environments. Stability of 1000 grain weight explained by both GGE and AMMI biplot ranked G 26 (GW 1139), G 27 (GW 1170), G 28 (GW 1209) and G 77 (N 59) as best stable genotypes for this trait and G 35 (HD 4676), G 78 (NI 5759) and G 84 (NP 404), are found to have high grain weight but least stable.
Over the years, genotypes G 39 (HI 8381), G 40 (HI 8498), G 63 (MACS 9), G 77 (N 59), G 82 (NIDW 295) and G 93 (Sawer Local) were the most stable genotypes for grain yield/plant and other contributing traits under study.
Discussion
Durum wheat showed significant genetic variability for grain yield and yield contributing traits under wide range of environmental conditions [30,31]. Extensive phenotyping of one hundred and two diverse genotypes selected from Indian Agricultural Research Institute, Regional Station, Indore germplasm showed ample variability for traits under study in six environments along with pooled conditions. High heritability coupled with genetic advance was exhibited by the traits also indicate that predominance of additive gene action in the expression of these characters, and consequently greater chance of improving these traits through simple selection. The heritability estimation is indicating the presence of positive response of durum wheat improvement through selection of these traits because of their higher heritability [32-36]. The range of variation showed by the traits under consideration suggested that the genes responsible for adaptation to wide range of environments under high temperature are available within the durum wheat germplasm Genetic variability among durum wheat genotypes can be estimated based on qualitative and quantitative traits. The choice of parents is of paramount importance in the breeding program. For effective selection, information on nature and magnitude of variation in the population, an association of character with yield and among themselves, and the extent of environmental influence on the expression of these characters are necessary and therefore grain yield and the other traits could be improved through appropriate breeding strategies under terminal heat stress [37-39].
Combined AMMI-ANOVA
Stable performance of genotype for the target trait(s) is the key requirement in germplasm enhancement and wider adaptation for cultivation. Present investigation revealed the presence of significant late sown environments for each trait under study. Significant proportions of G and G × E components to the total variation under terminal heat stress conditions which includes both late and very late sown conditions suggested that selection approaches can be employed in the breeding programme for improvement of yield and other yield contributing traits simultaneously. Significant level of G × E interaction for grain yield and other traits were also reported by [28, 40-44].
Stability analysis for grain yield and other trait by AMMI biplot analysis
Biplot is the most powerful interpretive tool for AAMI model. We plotted a biplot where the main effects (genotype mean and environment mean) and IPCA scores of both environments and genotypes are plotted against each other. In this biplot, the usual interpretation of a biplot assay is that if a genotype or an environment has IPCA score nearly zero, it has small interaction effects and found to be stable. AMMI biplot presenting both mean grain yield and stability were used to identify the best performing and highly adaptable genotypes across all the environments. The AMMI biplot showed that the six environments performed distinctly different for all the traits under consideration except for days to flowering, depicting the range of expression for a particular trait. The late sown 2011-12 is found to be the best environment for expression of most of the traits in the experiment. The AMMI biplot analysis identified the genotypes G77 (N 59) and G 82 (NIDW 295) as the most stable genotypes for grain yield and other traits under all the environments.
GGE biplot: Identification of stable genotype for grain yield and other traits
The late sown 2012-13 is found to be the best environment for expression of most of the traits in the experiment. The GGE biplot analysis identified the genotypes G 39 (HI 8381) as the most stable genotypes for grain yield and other traits under all the environments.
AMMI and GGE were found highly correlated for stability of all the traits. The stable genotypes ranked stable by both GGE and AMMI models suggested that both GGE and AMMI models are equally effective when contribution of environment variation is higher than the total variation. Over the years, genotypes G 39 (HI 8381), G 40 (HI 8498), G 63 (MACS 9), G 77 (N 59), G 82 (NIDW 295) and G 93 (Sawer Local) were the most stable genotypes for grain yield/plant and other contributing traits under study by both the models. Advantage of AMMI and GGE models were also reported in other cereal crops including wheat [45] and maize [46]. Similar to this research, [47,48] also identified the high responsive genotype of wheat in heat-stressed environment using which -won-where model of GGE biplot; and noted the vertex genotype as wining genotype in the corresponding environment. Also, [49] were able to identify high-yielding and specifically adapted variety to a specific environment deploying which-won-where model. Similar, findings were mentioned by [50,51]. Similar observation of stable genotypes was observed using Average Environment (tester) Coordinate methods by [44,52-54].
The discriminativeness vs representativeness view of GGE biplot allows evaluation of environment that is advantageous over AMMI biplot [55, 56]. Similarly, it also helps to find the environment capable of selecting superior genotypes in an efficient way. Discriminative vs. Representative GGE biplot has already been used by [57-61] to compare the discriminating ability and desirability of the environments.
Conclusion
This study indicates that the GGE and AMMI1 biplots are useful techniques that were able to effectively detect the existence of a significant amount of GE interaction between 102 durum wheat genotypes across six environments. Both models revealed that G 39 (HI 8381), G 40 (HI 8498), G 63 (MACS 9), G 77 (N 59), G 82 (NIDW 295) and G 93 (Sawer Local) were the most stable genotypes for grain yield/plant and other contributing traits indicating that they have the potential to increase durum wheat productivity under terminal heat stress and therefore are recommended for utilization in further breeding programmes and development of heat tolerant durum wheat varieties.
Acknowledgement
The authors are gratefully acknowledged to ICAR-Indian Agricultural Research Institute, Regional Station Indore, India, for providing valuable genotypes for the present study. Authors are also grateful to Head, ICAR-IARI, Regional Station, Indore for providing facilities to conduct research work.
Compliance with ethical standards: Conflict of interest
The authors declare that they have no conflict of interest.
- Wahid A, Gelani S, Ashraf M, Foolad MR (2007) Heat tolerance in plants: an overview. Envi Experi Bot 61: 199-223.
- Wang L (2011) Growth propagation of yeast in linear arrays of microfluidic chambers over many generations. Biomicro 5: 44118-9.
- Farooq M, Bramley H, Jairo A, Palta Kadambot, Siddique HM (2011) Heat Stress in Wheat during Reproductive and Grain-Filling Phases. Crit Rev Pl Sci 30: 1-17.
- Saini AK, Nanda JS, Lorsch JR, Hinnebusch AG (2010) Regulatory elements in eIF1A control the fidelity of start codon selection by modulating tRNA(i) (Met) binding to the ribosome. Genet Devi 24: 97-110.
- Hays K, Maynard I, Thomas O, Bawden M (2007) Sources and types of confidence identified by world class sport performers. J Appl Spo Psychol 19: 434-56.
- FAOSTAT (2020) Online Statistical Database: Food and Agriculture Data, USA.
- Acevedo E, Nachit M, Ortiz-Ferrara G (1991) Effects of heat stress on wheat and possible selection tools for use in breeding for tolerance. In: Saunders, DA (ed.) Wheat for the Nontraditional Warm Areas. CIMMYT, Mexico.
- Vani V, Prasad SV, Ambati D, Thakur R, Malviya P, et al. (2013) Suitability of Indian Durum Wheat For Home Made Food Products. Progressive Research 8: 195-9.
- Ganeva G, Korzun V, Landjeva S, Popova Z, Christov NK (2011) Genetic diversity assessment of Bulgarian durum wheat (Triticum durum Desf.) landraces and modern cultivars using microsatellite markers. Gen Res Crop Eval 57: 273-85.
- Viswanathan C, Khanna-Chopra R (2001) Effect of heat stress on grain growth, starch synthesis and protein synthesis in grains of wheat (Triticum aestivum L.) varieties differing in grain weight stability. J Agron Crop Sci 186: 1-7.
- Garcia del Moral LF, Rharrabti Y, Villegas D, Royo C (2003) Evaluation of grain yield and its components in durum wheat under Mediterranean conditions: an ontogenic approach. Agron J 95: 266-74.
- Koc M, Barutcular C, Tiryakioglu M (2008) Possible heat-tolerant cultivar improvement through the use of flag leaf gas exchange traits in a Mediterranean Environment. J Sci Food Agri Res 88: 1638-47.
- Akther N, Rafiqual IM (2017) Heat stress effects and management in wheat. A review. Agro Sustain Develop 37: 37.
- Reynolds MP, Rebetzke G (2011) Application of plant physiology in wheat breeding. In AP Bonjean, WJ 5 Angus, M Van Ginkel, eds, The World Wheat Book. A history of Wheat Breeding, Vol 2. Editions 6 TEC, Paris.
- Gautam A, Sai Prasad SV, Jajoo A (2013) Identification of selection parameters for grain yield and its components in durum wheat under terminal heat stress in late sown conditions to combat climate changes. Prog Res 8: 55-9.
- Shukla GK (1972) Some aspects of partitioning genotype-environmental components of variability. Heredit 29: 237-45.
- Gautam A, Sai Prasad SV, Jajoo A, Ambati D (2015) Canopy temperature as a selection parameter for grain yield and its components in durum wheat under terminal heat stress in late sown conditions. Agri Res 4: 238-44.
- Lin CS, Binns MR, Lefkovitch LP (1986) Stability analysis: where do we stand? Crop Sci 26: 894-900.
- Francis TR, Kannenberg LW (1978) Yield stability studied in short-season maize. I. A descriptive method for grouping genotypes. Canadian J Pl Sci 58: 1029-34.
- Gauch HG (1988) Model selection and validation for yield trials with interaction. Biom 44: 705-15.
- Zobel R (1993) Stress resistance and root systems. In: Maranville JW, editor. Proceedings of the Workshop on Adaptation of Plants to Soil Stresses; 1993 Aug 1–4; Institute of Agriculture and Natural Recourses. University of Nebraska, Lincoln, USA.
- Yan W, Hunt LA, Sheng Q, Szlavnics Z (2000) Cultivar evaluation and mega-environment investigation based on GGE biplot. Crop Sciences 40: 597-605.
- Chatrath R, Mishra B, Ortiz-Ferrara G, Singh SK, Joshi A (2007) Challenges to wheat production in South Asia. Euphy 157: 447-56.
- Fischer RA, Byerlee D, Edmeades G (2014) Crop yields and global food security. Will yield increase continue to feed the world? Canberra. Australian Centre for International Agricultural Research, Australia.
- Zadoks JC, Chang TT, Konzak CF (1974) A decimal code for growth stages of cereals. Weed Res 14: 15-42.
- Genstat. 2013 Genstat for Windows. Release 16.1. VSN International Ltd.
- Gauch HG (1992) Statistical analysis of regional yield trials: AMMI analysis of factorial designs. 1st ed. Amsterdam. Elsevier.
- Yan W, Kang MS (2003) GGE Biplot Analysis: A Graphical Tool for Breeders, Geneticists, and Agronomists. 1st ed. Boca Raton, FL: CRC Press.
- Yan W, Kang MS, Ma B (2007) Woods S, Cornelius PL. GGE biplot vs. AMMI analysis of genotype-by-environment data. Crop Sci 47: 643-55.
- Sahu SR, Dhari, Joshi AK (2005) Variability studies in wheat (Triticum aestivum L.) under late sown conditions. Indian Journal of Genetics 65: 309-10.
- Mohtasham M, Peyman S, Rahmatollah K, Mohammad K (2012) Sequential Path analysis for determination of relationships between yield and oil content and yield components of safflower. Inter J Agri Res Rev 4: 410-5.
- Wolde T, Eticha F, Alamerew S, Assefa E, Dutamo D (2016) Genetic variability, heritability and genetic advance for yield and yield related traits in durum wheat (Triticum durum L.) accessions. Sky J Agril Res 5: 42-7.
- Kabir R, Ahmed I, Rehman AU, Qamar M, Intikhab A, et al. (2017) Evaluation of bread wheat genotypes for variability and association among yield and yield related traits. Int J Biosci 11: 7-14.
- Rathwa HK, Pansuriya AG, Patel J, Jalu RK (2018) Genetic variability, heritability and genetic advance in durum wheat (Triticum durum Desf.). Int J Current Microbio Appli Sci 7: 1208-15.
- Hossain MM, Kalam Azad MA, Alam MS, El-Jaoual Eaton T (2021) Estimation of Variability, Heritability and Genetic Advance for Phenological, Physiological and Yield Contributing Attributes in Wheat Genotypes under Heat Stress Condition. American J Plant Sci 12: 586-602.
- Malbhage AB, Talpada MM, Shekhawat VS, Mehta DR (2020) Genetic variability, heritability and genetic advance in durum wheat (Triticum durum L.) J Pharma Phytochem 9: 3233-6.
- Krasimira T, Violeta B, Ivanka P (2019) Variability, heritability and genetic advance of some grain quality traits and grain yield in durum wheat genotypes. Bulgarian J Agri Sci 25: 288-95.
- Zemede A, Mekbib F, Assefa K, Bishaw Z (2019) Variability in Ethiopian Durum Wheat under Rainfed Environment Subjected to Drought at Anthesis Ethiop. J Agric Sci 29: 17-29.
- Menzir A, Anley, Dejene T, Abebe (2020) Genetic variability and association of traits in Ethiopian durum wheat (Triticum turgidium L. var. durum) landraces at Dabat Research Station, North Gondar Yohannes. Cogent Food Agri 6: 3-21.
- Popovi C, Natasa Ljubi CI, Kosti M, Radulovi M, Blagojevi D, et al. (2020) Genotype × Environment Interaction for Wheat Yield Traits Suitable for Selection in Different Seed Priming Conditions Vera. Plants 9: 2-14.
- Amhara MM, Getenet S, Muluken B, Amleku T, Eshetie A, et al. (2020) Participatory variety selection and stability analysis of Durum wheat varieties (Triticum durum Desf.) in northwest. Cogent Food & Agri 6: 2-15.
- Ram K, Munjal R, Kesh H, Suresh, Kumari A (2020) AMMI and GGE Biplot Analysis for Yield Stability of Wheat Genotypes under Drought and High Temperature Stress. Int J Curr Microbiol App Sci 9: 377-89.
- Gupta RSS, Singh RP, Tiwari DK (2004) Analysis of path coefficient for yield and its related characters in bread wheat (Triticum aestivum L.). Adv Pl Sci 17: 299-302.
- Gregorio GB (2002) Plant breeding: a new tool for fighting micronutrient malnutrition, progress in breeding for trace minerals in staple crops. J Nutri 132: 500-2.
- Oikeh SO, Menkir A, Maziya-Dixon B, Welch R, Glahn RP (2003) Assessment of concentrations of iron and zinc and bio available iron in grains of early-maturing tropical maize varieties. J Agri Food Chem 51: 3688-94.
- Prasanna BM, Mazumdar S, Chakraborti M, Hossain F, Manjaiah KM, et al. (2011) Genetic variability and genotype × environment interactions for kernel iron and zinc concentrations in maize (Zea mays) genotypes. Indian J Agri Sci 81: 704-71.
- Annicchiarico P (1997) Additive main effects and multiplicative interaction (AMMI) analysis of genotype-location interaction in variety trials repeated over years. The Applied Genet 1072-7.
- Argiller O, Hebert Y, Barriere Y (1994) Statistical analysis and interpretation of line environment interaction for biomass yield in maize. Agron 14: 661-72.
- Thungo Z, Shimelis H, Odindo A, Mashilo J (2020) Genotype-by-environment effects on grain quality among heat and drought tolerant bread wheat (Triticum aestivum L.) genotypes. J Plant Interact 15: 83-92.
- Poudel MR, Ghimire S, Pandey MP, Dhakal K, Thapa DB, et al. (2020b) Yield stability analysis of wheat genotypes at irrigated, heat stress and drought condition. J Biol Today World 9: 220.
- Neisse AC, Kirch JL, Hongyu K (2018) AMMI and GGE Biplot for genotype-environment interaction: a medoid–based hierarchical cluster analysis approach for high–dimensional data. Biom Lett 55: 97-121.
- Gupta V, Kumar P, Singh C, Gupta A, Sendhil R, et al. (2017) Genotype x environment interaction analysis of multi-environment wheat trials in India using AMMI and GGE biplot models. Crop Breed App Biotechnol 19.
- Kendal E (2019) Comparing durum wheat cultivars by genotype yield trait and genotype trait biplot method. Chil J Agric Res 79.
- Yan W (2001) GGE biplot – a windows application for graphical analysis of multi-environment trial data and other types of two-way data. Agron J 93: 1111-8.
- Yan W, Hunt LA (2001) Interpretation of genotype environment interaction for winter wheat yield in Ontario. Crop Sci 41: 19-25.
- Singh C, Gupta A, Gupta, V, Kumar P, Sendhil R, et al. (2019) Genotype x environment interaction analysis of multi-environment wheat trials in India using AMMI and GGE biplot models. Crop Breed Appl Biotechnol 19.
- Yan W, Kang MS, Ma B, Woods S, Cornelius P (2007) GGE Biplot vs. AMMI analysis of genotype-by-environment data. Crop Sci 47: 643-55.
- Aktas H (2016) Tracing highly adapted stable yielding bread wheat (Triticum aestivum L.) genotypes for greatly variable South-Eastern Turkey. Appl Ecol Environ Res 14: 159-76.
- Philipo M, Ndakidemi PA, Mbega ER (2021) Environmentally stable common bean genotypes for production in different agro-ecological zones of Tanzania. Heliyon 7: E05973.
- Kendal E (2019) Comparing durum wheat cultivars by genotype yield trait and genotype trait biplot method. Chil J Agric Res 79.
- Gupta V, Kumar P, Singh C, Gupta A, Sendhil R, et al. (2017) Genotype x environment interaction analysis of multi-environment wheat trials in India using AMMI and GGE biplot models. Crop Breed App Biotechnol 19.