Biology (SPBR)
Stechnolock: Plant Biology and Research
Full Text
Volume 1, Issue 1
The effect of integrated application of Vermicompost and NPS fertilizer on soil physicochemical properties and yield of maize (Zea May L.) crop at Toke Kutaye district, Western Ethiopia
*Corresponding Author: Tesfaye Wakgari, Ambo University, Department of Natural Resource Management, Ethiopia, Tel: +251979018414, E-mail: wagarit06@gmail.com
doi: /spbr.2021.1.106
Citation: Tolera Emamu, Tesfaye Wakgari (2021) The effect of integrated application of Vermicompost and NPS fertilizer on soil physicochemical properties and yield of maize (Zea May L.) crop at Toke Kutaye district, Western Ethiopia. Stechnolock Plant Biol Res 1:1-16
Copyright: © 2021 Tesfaye Wakgari. This is an open-access article distributed under the terms of Creative Commons Attribution License, which permits unrestricted use, distribution, and reproduction in any medium, provided the original author and source are credited.
Abstract
Low soil fertility and nutrient unavailability due to loss of soil organic matter content and low fertilizer input are among the major maize crop production constraints in Ethiopia, particularly, in Toke kutaye Woreda. An integrated use of vermicompost and NPS fertilizers are indispensible to improve this condition of soil. Cognizant of this fact, a study was conducted in 2019/2020 to assess the effect of combined use of vermicompost and NPS fertilizer on soil physicochemical properties and yield of maize. In order to achieve this objective field experiment was laid out in a randomized complete block design and replicated three times. The treatments consist of different combinations of vermicompost and NPS fertilizer rates. The results of the study showed that all the treatments applied were improved soil moisture and total porosity over control or NPS fertilizer alone, while, bulk density was decreased below the control due to the different rates of organic amendments. The higher pH value of vermicompost caused relative increase in soil pH over the control. It was observed that the application of vermicompost along with NPS fertilizers increased the contents of organic matter, total nitrogen, available phosphorus, available sulfur, exchangeable potassium over the control. Moreover, increasing doses of amendments applied to soil increased grain yield, than that of control treatment, sole use of vermicompost and NPS fertilizer, and low rate application. It can be concluded that the application of vermicompost along with NPS fertilizers were improved organic matter and nutrient contents of the soils which in turn increased crop yields. Hence, in order to maintain soil fertility and sustain maize crop production, farmers of the study area and similar agro ecologies are advised to make integrated use of vermicompost at (5 t ha-1) and NPS inorganic fertilizer at (50 kg ha-1) tentatively. Nevertheless, to develop a concrete recommendation further research studies are needed over long seasons, soil types and crop varieties.
Keywords: Soil fertility; NPS fertilizer; Physicochemical Properties; Vermicompost
Introduction
Low soil fertility and nutrient unavailability due to loss of soil organic matter content and low level of fertilizer input are among the major maize crop production constraints in Ethiopia [1]. However, an organic farming or chemical fertilizers are used as solution for such situations, there are some problems related to chemical fertilizer such as inadequate supply or even unavailability of fertilizer at the time of need and becoming very costly for farmers to apply the full recommended rates [2]. Further, continuous use of chemical fertilizer creates potential polluting effect on the environment. On the other hand, sole application of organic matter is constrained by access to sufficient organic inputs, low nutrient content, high labor demand for preparation and transporting [3].
Abera and Belachew [4] stated that neither inorganic nor organic fertilizers alone can result in sustainable productivity. Integrated use of organic sources such as vermicompost and inorganic sources such as NPS fertilizer are better than application of either vermicompost or NPS fertilizer alone for maize production [5]. In another study conducted at Hawassa, southern Ethiopia, the integrated use of coffee by products and N fertilizer increased N uptake and grain yield of maize [6]. Moreover, the combined use of vermicompost and NPS fertilizers affect soil physicochemical properties and maize yield more than chemical fertilizer or vermicompost alone [7].
Thus, it is pertinent to study the response of maize crop to combined application of vermicompost and NPS fertilizer. However, there is no research conducted on an integrated nutrient management for maize production at Toke Kutaye district. Hence, this calls for a need of research on improvement of soil fertility status and response of maize crop to the combined use of vermicompost and NPS chemical fertilizers. Keeping in view the above facts, the present study was therefore designed to assess the effect of combined application of vermicompost and NPS fertilizer on selected soil physicochemical properties and yield of maize at Toke Kutaye Woreda.
Materials and Methods
Description of the study area Location and area coverage
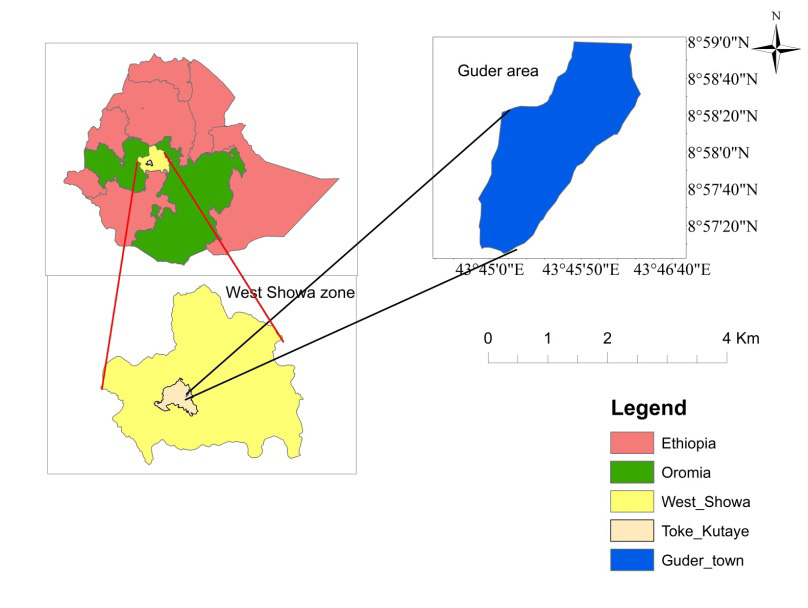
The field experiment was conducted at Ambo University Guder campus, which is found in Toke Kutaye district of Western Shewa Zone, Oromia Regional State at a distance of approximately 138 and 12 km, respectively, from Addis Ababa and Ambo town. Toke Kutaye district is located at latitude of 8° 49’0”-9° 5’30”N and longitude of 37° 26’0’’-37° 57’30”E Toke Kutaye district has the total area of 51,313.19 hectares [8].
Climate and topography of the study area
The study area has the annual rainfall ranges from 800-1100 mm. The district has a unimodal rainfall pattern in which rain is received from April to September, but the highest rains are received from June to August. The minimum and maximum temperatures of the district are 10 and 29oC, respectively. The altitude of the area ranges from 1,880-3,194 m above sea level [9].
Geological parent materials and soil types
The soils of the study area are developed from different parent materials such as schist, granite, gneiss and basalt through weathering. According to Abera et al. [10] the dominant soil type of a study area is vertisol. Furthermore, soils of the study area are strongly to moderately acidic in reaction with loose and friable consistence, deep and well drained and clay in texture.
Methods of Study
Compost materials and vermicompost preparation procedures: Vermicompost was prepared a head of field experiment by using earthworm and organic materials such as green plants, animals dung, pulse straw and inputs like cattle manure was used as bedding materials for Vermicomposting and bulking in the composting process. For vermicompost preparation, vermicompost bin with 2m length, 1m width and 1m deep was used. The bin has a lid to keep out ants, birds, flies and rodents and holes in the bottom a quarter inch or smaller for ventilation and drainage. Since worms like moderate temperature, the bin was placed in a shady location where it was not overheat [11].
At the bottom of the bin vermicompost material such as green plants, animal’s dung, pulse’s straw were added as bedding material. Then, compost materials was placed in stacks according to the following sequences of layer of crop residues/green plants (20 cm) or 60%, a layer of manure (animal dung, sheep manure) (5-10 cm) or 30%, and a layer of topsoil (2-4 cm) or 10% [12]. Some layer of soil spread over it again and worms are introduced to the bin. The materials in the bin were turned every 3 days and regular watering was done to keep moisture and make the materials soft for the worms. After composting was completed new stack of compost materials was prepared to one side of bin and the worms were gradually moved to the new stack by leaving the finished vermicompost. Then, the finished vermicompost was harvested and it is dark in color light and free from any unpleasant odor [13].
Experimental treatments and design
The experiment was laid out in a Randomized Complete Block Design (RCBD) with nine treatments and three replications. The treatment consists of combination of vermicompost and chemical NPS fertilizer. Recommended rate of Vermicompost 10 t ha-1 was used depending up on recommendations given by different researchers [14]. While, the rate of NPS fertilizers was determined from locally blanket recommendation that is in use by the local farmers. The recommended rate of NPS fertilizer 100 kg ha-1 was derived from DAP (Di-ammonium phosphate) as per suggestion by ATA [15]. The following nine treatments was included:
Experimental procedures and field management
The field experiment was conducted to evaluate different rates of NPS fertilizers integrated with vermicompost using maize crop of FS53xFS67xKit23 Jibat variety which was released from Ambo Plant Protection Research center and its yield potential on research field is 6.5-7.8 t ha-1and on farmers’ fields is 4.5-5.5 t ha-1 [16]. The total land area selected for the experiment was 352.35 m2 (26.1 m x 13.5 m). It was divided into three blocks and each block was divided into nine sub-plots. The spacing between blocks, plots, rows and plants were 1, 0.5, 0.7, and 0.3 m, respectively. Land preparation (seed bed preparation) of experimental test field was done by ploughing three times with traditional oxen driven practices. Plowing was done twice per week interval to destroy the emerging weeds. Harrowing was done after plowing to further pulverize larger soil aggregates.
Vermicompost was applied by hand in the row and thoroughly mixed with top surface layer soils of each plot one month before planting because immediate sowing of crop after vermicompost application sometimes sufficient time must be permitted for more decomposition before sowing of crops. Inorganic fertilizers was placed in a hole 5 cm from the seeds in the furrow covered with a thin layer of soil then followed by the sowing of seeds and then covered again with soil to have a close contact between the seed and the soil, thus, would facilitate uniform germination. Maize crop was hand drilled at recommended seeding rate of 20-25 kg ha-1 [17]. Sowing was conducted in the first week of April in 2019. All management aspects were done by adopting the recommended agronomic practices of maize production and local practices.
Soil sampling and analysis
To determine soil physicochemical properties, composite and undisturbed soil samples were drawn from top layer of each experimental unit before and after planting. Soil samples from 0-30 cm depth were collected prior to maize planting for analysis of selected soil physicochemical properties before planting. A total of three composite samples were collected from the three blocks. Soil samples were collected by auger from nine plots and thoroughly mixed to make one composite sample per each block. At the same time, undisturbed core samples from 0-30 cm depth layer was also collected randomly by taking one sample per block using core method to determine soil bulk density before planting.
For soil sampling after harvesting from each plot an auger was used to sample five randomly selected spots per plot. These five subsample soils combined into one composite soil sample per each plot for investigating soil properties of each treatment. Similarly, undisturbed core samples from 0-30 cm depth layer were also collected to determine soil bulk density of each plot. The collected soil samples were bagged, labeled and transported to the laboratory for preparation and analysis of soil properties. Sufficient amount of composite soil samples were air dried and ground to pass through a 2 mm sieve in preparation for the analyses of the selected physicochemical properties following standard laboratory procedures [18] portion of the disturbed soil samples were taken and sieved using 0.5 mm diameter for the determinations of organic matter and total nitrogen. Soil sample preparation and analysis was done at Holeta agricultural research centre. The samples were analyzed for particle size distribution, soil texture, bulk density, particle density, porosity, moisture content, pH, available Phosphorus, available potassium, available sulfur, total Nitrogen, organic carbon, cation exchange capacity.
Laboratory analysis of soil
Soil physical properties<
Particle size distribution was determined by the hydrometer method [19] and textural classes were assigned using the USDA soil textural triangle [20]. Bulk density was determined using the core method as described by Jamison [21]. Particle density was described using the pycnometer method following procedures described by Rao et al. [22]. Total porosity was calculated from the values of bulk density and particle density using the method described by Rowell [23]. Soil moisture content was determined using gravimetric method as described by Reynolds [24].
Soil chemical properties
Soil pH was measured in a soil-water suspension by the glass electrode pH meter [25] at 1:2.5 soils to water ratios. Soil organic carbon was determined using the Walkley - Black wet oxidation procedure [26] and the soil organic matter content was determined from the organic carbon as suggested by Nelson and Sommers [27]. Total nitrogen content in the soils was determined using the Kjeldahl procedure [28]. Available P in the soil samples was extracted by using Bray II method [29]. The Phosphorus extracted with this method was measured by spectrophotometer following the procedures described by Murphy and Riley [30]. Available sulfur was extracted with ammonium acetate (1N NH4OAc) and determined using gravimetric determination method as described by Warman and Sampson [31]. Exchangeable potassium was extracted with neutral normal ammonium acetate and the content of potassium in the extract was estimated by flame photometer [32]. Cation exchange capacity (CEC) of the soil was determined with the ammonium acetate saturated samples using Na from percolating NaCl solution to replace the ammonium ions [33].
Chemical Composition of vermicompost
To determine the composition of the vermicompost, samples of 100 g were collected for chemical analysis. Compost samples were analyzed for the chemical parameters such as pH, total organic carbon, total Nitrogen, potassium and Phosphorus. The pH of vermicompost was determined by method described by USDA [34]. Total organic carbon is described by Chapman and Pratt [35] method. The total Nitrogen content of vermicompost was determined using Kjeldahl procedure [36]. The total phosphorus content was determined by method described by Olsen [37] and total potassium content was described by Hesse [38].
Agronomic data collection
For determination of grain yield six maize plants were pre-tagged and randomly selected from each plot for sampling. Grain yield, cobs of each plot were shelled and weighted to have grain yield per plot, then yield were converted from Kg/plot in to hectare by adjusted to 12.5% moisture content.
Data analysis and interpretation
Analytically determined soil physicochemical and grain yield data were subjected to analysis of variance using GLM procedures of the Statistical Analysis System Software (version 9.0) [39]. Whenever the ANOVA detects significant differences (P<0.05) between treatments, mean separation was conducted using Fisher’s Least Significant Difference (LSD) test. Simple correlation analysis was also conducted to identify useful associations among key soil variables and grain yield.
Results and Discussion
Physicochemical properties of the experimental site soils before planting and chemical properties of vermicompost Soil physicochemical properties before experiment
Soil physical properties
The result showed that the soil particle size distribution was 15.1% sand, 35.3% silt and 49.6% clay (Table 2). Thus the textural class of the soil under investigation was clay. The fact that the textural class of soil is clay, an inherent soil property, might be indicated indirectly good nutrient retention and water holding capacity of the soil. According to Okoko and Makworo [40] maize is best adapted to well-drained sandy loam to clay soil. Thus, from the above result, the soil texture is suitable for maize production.
The measured bulk density (1.28 g.cm-3) was below the critical value of bulk density (1.4 g.cm-3) for plant growth at which root penetration, is likely to be severely restricted for clay soil [41]. Moreover, according to Negesse and Tesfaye [42], the ideal total porosity values for health root growth is >50% and thus porosity and bulk density values of the recognized pedons in the surface area were in acceptable range for crop production including maize crop (Table 2).
Soil chemical properties
Soil pH reflects the overall chemical status of the soil and influences a whole range of chemical and biological processes occurring in the soils [43]. The analysis result of this study indicated that the soil was in slightly acidic soil reaction range (5.24 pH) as per soil pH rating proposed by Landon [44] (Table 3). Most plants and soil organisms prefer pH range between 6.0 and 7.5 [45]. Moreover, maize has been found to do well in pH ranges of 6.5-8 but the optimum growth is attained at pH 5.5-7. Therefore, the results obtained from experimental site soil showed that the pH of the soil is out of this normal pH range; which indicates the availability of essential nutrients for maize crop is critically affected.
Soil organic carbon is an essential soil property in soil fertility decline studies [46]. According to organic carbon rating by Berhanu [47] soil organic carbon content of the experimental site (1.61%) was in medium range. Furthermore, the total nitrogen of study area (0.14%) was rated as low in total nitrogen [48].The value of C: N ratio of the soil of study was 11.5 (Table 3).This value indicates that soil organic reserve of the soils of area is well decomposed and mineral N can be released for maize plant use. Similarly, Tesfaye et al. [49] also reported that C:N ratio less than 20:1 can release mineral N for crops.
The Bray II extractable soil available phosphorus of experimental site was 9.01 ppm, which was slightly above the critical level (8 ppm) for most Ethiopian soils as suggested by Tekalign and Haque [50] and in low range as per rating by Jones [51] for available soil Phosphorus. The available sulfur content of the soil (2.97 ppm) is in low range [52]. Similarly, the cation exchange capacity of the experimental site (21.14 cmol(+)kg-1) was rated as moderate according to rating by Roman [53] (Table 3). In general, the result of pre planting soil analysis showed that the soils of the experimental site were poor in fertility status. The low values recorded for total nitrogen, available phosphorus and available sulfur might be due to the continuous low input of inorganic fertilizer and lack of incorporation of organic residues into the soils. The low contents of total N, available S, available P observed in the soil of the study area are in agreement with the results reported by Tekalign and Haque [54] and Tilahun [55] for most Ethiopian soils.
Chemical properties of vermicompost used in experiment
Vermicompost was analyzed for chemical properties such as pH, organic carbon, total nitrogen, available phosphorus, exchangeable potassium (Table 4). The result showed that the average pH (1:2.5 H2O) reading of the compost was 6.85, which is neutral in reaction. Moreover, the mean organic carbon and total nitrogen contents of the compost were 11.76 and 1.64%, respectively. The C: N ratio of about 7.17 (Table 4) which is very narrow; the narrow carbon to nitrogen ratio in the vermicompost indicates that the compost is well decomposed and N can be released to soil for plant use. In line with this Brady and Weil [56] also reported that C:N ratio of compost below 20:1 before application to soil can release N.
Effect of Vermicompost and NPS fertilizer on soil physicochemical properties after planting
Soil physical properties after planting: Significant(p<0.05) variation was observed on bulk density, total porosity of the soil, soil moisture and as the field was incorporated with different doses of vermicompost and NPS fertilizers (Table 5).
Bulk density:
Soil bulk density of treatments ranges from 0.91 to 1.25 g.cm-3. The lowest value of bulk density (0. 91g.cm-3) was observed from plots treated by 15 t ha-1 VC+100kg ha-1 NPS fertilizer. But, the highest value of bulk density (1.25g.cm3) was recorded from control treatment. The lowest bulk density values among the rest of the treatments might be attributed to the bulk density decreasing effect of the vermicompost which can be evidenced from the strong correlation (r = -0.67**) between the soil organic matter and bulk density (Table 8). In agreement with this, Demir and Gulser [57] reported the fact that organic matter possesses low bulk density when incorporated with soil it could therefore reduce soil bulk density. Similarly, Tesfaye et al. [58] also reported the inverse relationship between bulk density and organic matter sourced from industrial wastes.
Total Porosity of Soil
Different doses of vermicompost and NPS fertilizers had significant effect on total porosity of soil (Table 5). The highest value of total porosity (65.6%) was obtained from application of 15 t ha-1 VC +100 kg ha-1 NPS fertilizer and the lowest value (52.8%) was recorded from control treatment. The highest values of total porosity obtained for 15 t ha-1 VC +100 kg ha-1 NPS fertilizers corresponded to the higher amount of organic matter contents and lower bulk density values. In line with this, Hillel [59] reported that the low total porosity was the reflection of the low organic matter content and the high bulk density. This is further supported by Sanginga and Gulser [60] who reported reduced bulk density due to increased soil pores as the result of incorporation of higher soil organic matter to soil from organic fertilizer that ultimately improved soil total porosity.
Soil Moisture
Soil moisture content is the next important component of soil physical parameters which range from 37.06 to 43.44% for the different doses of vermicompost and NPS fertilizers (Table 5). The highest percentage of soil moisture content (43.44%) was recorded from plot treated by 10 t ha-1 VC+ 100 kg ha-1 NPS fertilizer and the lowest values (37.06%) were recorded from control treatment. All the treatments applied (combination of VC and NPS fertilizers) were improved soil moisture over control or NPS fertilizer alone. This might be due to enrichment of soil with vermicompost which have high surface area (high water retaining capacity). Similarly, Mirzaei et al. [61] studied increasing of moisture content as a result of continuous application of farm yard manure.
Soil chemical properties after experiment
Combination of vermicompost and NPS fertilizer rates significantly (p<0.05) and highly affected soil pH, total nitrogen, organic carbon, soil available phosphorus, available sulfur, exchangeable potassium and CEC (Table 6).
Soil pH
Data pertaining to the soil pH as influenced by vermicompost and inorganic NPS fertilizer is given in Table 6. The maximum value of soil pH (5.92) was recorded from 15 t ha-1VC +50 kg ha-1 NPS fertilizer and it was followed by 10 t ha-1 VC +100 kg ha-1 NPS fertilizer, while, minimum soil pH (5.25) was recorded from control treatment. The pH value after application of the different rates of two amendments; fall within range of moderately acidic as per rating suggested by Murphy [62]. The relatively increase in pH over the control as rate of vermicompost increase could be attributed to the high pH value of the compost. This could be confirmed by significantly and positively correlation (r=0.930**) of soil pH with organic carbon (Table 8). Similarly, Tesfaye et al. [63] reported increase of pH as result of filter cake compost application to soil.
Total nitrogen (TN)
The total nitrogen which is a major nutrient element determining crop yield was in the range of 0.151-0.298% after application of different rates of amendments (Table 6). These values are found in moderate to high range based on the ratings suggested by Landon [66]. Thus; the soil of the experimental site requires nitrogen application as maize was highly exhaustive crop for nitrogen. The highest value of soil total nitrogen (0.298%) was recorded from treatment with 15 t ha-1 VC + 100 kg ha-1 NPS fertilizer and followed by 0.294% from 10 t ha-1 VC+100 kg ha-1 NPS fertilizer while, the lowest value of total nitrogen (0.151%) was recorded from control treatment. The highest total nitrogen from the 15 t ha-1 VC +100 kg ha-1 NPS fertilizer might be attributed to N released from compost through mineralization and N supplied to soil from the NPS fertilizer. As the amount of organic carbon increases in the soil through application of vermicompost fertilizer, total nitrogen also increases. This can be evidenced by significantly and positive correlation (r=0.946**) between total nitrogen and organic carbon (Table 8). In other study, the increase in the total nitrogen content of the soil through vermicompost application to soil was reported by Zupanc and Zupanc [67].
Available phosphorus (av. P)
P is the most commonly plant growth-limiting nutrient in the tropical soils next to water and N. The rate at which the plant absorbs phosphate ions is influenced by their concentration in the soil solutions. The concentration of available p in soil after applying vermicompost and NPS fertilizer ranges from 9.22 to 23.49 ppm which falls in medium to high range as per rating suggested by Shara and Singh 68].The maximum available phosphorus (23.49ppm) was obtained from 15 t ha-1 VC + 100 kg ha-1NPS fertilizer and the minimum (9.22 ppm) was observed from without vermicompost and NPS treatment. The highest available phosphorus obtained from 15 t ha-1 VC+100 kg ha-1 NPS fertilizer might be due to release of phosphorus from vermicompost and supply of phosphorus to soil by NPS fertilizer. The positive and significant correlation (r=0.922**) between phosphorus and organic carbon can be taken as evidence for this (Table 8). This finding is in agreement with Inal et al. [69] who reported that increase in concentration of available p in soil after applying vermicompost and NPS fertilizer. Further the study by Habtamu et al. [70] who reported that incorporation of farmyard manure 15 t ha-1 along with phosphorus 66 kg ha-1 caused two fold increases in the available phosphorus content of soil after harvest also supports the finding.
Available sulfur (av. S)
Available sulfur in the experimental site ranged from 2.98 to 3.95 mg kg-1 after applying vermicompost and NPS fertilizer (Table 6). The available sulfur contents of samples from all treatments were found to be below the critical level suggested by Kebede and Yamoah [71]. The highest value of available sulfur (3.95ppm) was recorded from treatment 15 t. ha-1 VC + 100 kg ha-1 NPS fertilizer and the lowest value (2.98 ppm) was recorded from control treatment. The increase in available sulfur over the control might be due to the sulfur supplied to the soil from both vermicompost and chemical fertilizer. Similarly, Kibunja et al.
[72] reported that integrated use of organic and inorganic fertilizers improved the sulfur status of soil. Moreover, this can be confirmed by positive and significant correlation (r=0.958**) between sulfur and organic carbon (Table 8).
Exchangeable potassium (ex. K)
Because of absence of a remarkable response to potassium application in the central and northern part of the country; there is limited knowledge on the potassium dynamics in Ethiopian soils [73]. The exchangeable Potassium of experimental site ranged from 0.42 to 0.61 cmol+kg-1, which ranges from medium to high according to rating by FAO [74], after applying vermicompost and NPS fertilizers (Table 6). The highest value of exchangeable potassium (0.61 cmol+kg-1) was recorded from 15 t ha-1 VC +100 kg ha-1 NPS fertilizer whereas the lowest value (0.42 cmol+kg-1) was recorded from control treatment (Table 6). The increment in exchangeable potassium over the control might be due to potassium released from vermicompost to soils. Soil exchangeable potassium level increased with Vermicompost doses treatments might be due to high potassium content of vermicompost (Table 4). This also confirmed by significant and positive correlation (r=0.886**) of exchangeable potassium with organic carbon (Table 8). In agreement with this, Ibrahim et al. [75] reported increase of exchangeable potassium with increasing doses of vermicompost.
Cation exchange capacity (CEC)
Cation exchange capacity which can indicate the types of clay minerals present in the soil and the capacity of soil to retain nutrients and water; ranges between 22.20 to 25.24 cmo+Kg-1after applying vermicompost and NPS fertilizers (Table 6). According to rating by Brar et al. [76] these values fall in the range of moderate to high. The highest value of CEC (25.23 cmo+Kg-1) was recorded from 15 t ha-1VC +100 kg ha-1 NPS fertilizer, whereas, the lowest value (22.20 cmol+Kg-1) was recorded from control treatment. As per report by Ngome et al. [77] vermicompost is an organic amendment that consist of majority of nutrients, such as phosphates, exchangeable K, exchangeable Mg and Ca in plant-available forms. Therefore, the increment in CEC over the control might be directly related with increasing of soil organic matter as a result of application of increasing dose of vermicompost. This can further be confirmed by significant and positive correlation (r=0.961**) between CEC and organic carbon (Table 8). Similarly, Mitiku and Asnakech [78] also reported the increase of CEC over the control due to application of increasing dose of vermicompost. From these findings, the application of vermicompost along with NPS fertilizer with high nutrient content were justified to improve soil organic matter and nutrient contents that might be enhanced soil fertility status. The application of organic along with inorganic fertilizers is very common practices to replenish soil nitrogen, phosphorus and potassium status [79]. This might be why plots that have received vermicompost or VC + NPS fertilizer had higher N and P contents.
Effect of vermicompost and NPS fertilizer on grain yield of maize crop
The effect of vermicompost and NPS fertilizer rates were significantly (p<0.05) affected grain yield of maize crop. Accordingly, the highest grain yield (7.36 t ha-1) was recorded from 5 t ha-1 VC +50 kg ha-1 NPS fertilizer ha-1 and followed by that (7.31 t ha-1) was recorded from 10 t ha-1VC + 100 kg ha-1NPS fertilizer, while the lowest grain yield (2.94 t ha-1) was recorded from control plot or treatment (Table 9). The sole application of recommended NPS fertilizer increased maize yield by 52.27% over control treatment whereas sole application of full dose of vermicompost increased maize yield by 55.72% over control treatment. This showed that, organic fertilizer might have been more advantage than inorganic fertilizer in maximizing productivity if properly used. Furthermore, the combined use of vermicompost and NPS fertilizer by rating of half of recommended rate of both fertilizers increased maize yield by 60.05% over control treatment. This indicated that, combined use of organic and inorganic fertilizer more valuable than sole use of the fertilizers.
The highest grain yield with the application of vermicompost and NPS fertilizer might be attributed to the improving action of amendments on the soil physicochemical properties and nutrients status in the soil, which enhances plant growth. These finding was supported by Opala et al. [80] who reported that maximum grain yield of maize was recorded when 100% of NPK was applied with farmyard manure of 10 t ha-1. Also the finding was in line with Pisa and Wuta [81] who reported that in high potential maize growing areas the average grain yield ranges from 7 to 8 t ha-1.
Conclusion and Recommendation
The result of this study showed that soil particle size distribution was 15.1% sand, 35.3% silt and 49.6% clay (clay textural class) which is suitable for maize production. Likewise, the porosity and bulk density values for investigated surface soil were in acceptable range for crop production including maize crop. The analysis result indicated that the soil was in slightly acidic soil reaction range (5.24 pH) and out of normal pH range for good availability of essential nutrients for maize crop. Similarly, the fertility status of study area soils in terms of total nitrogen, available phosphorus and available sulfur contents was low
The field experiment result further revealed that combined application of vermicompost and NPS fertilizers were improved soil moisture and total porosity over control or NPS fertilizer alone, while, bulk density was decreased below the control due to the different rates of organic amendments. The higher pH value of vermicompost caused relative increase in soil pH over the control. Moreover, the application of organic along with inorganic fertilizers increased the contents of organic matter, total nitrogen, available phosphorus, available sulfur, exchangeable potassium over the control. The incorporation of vermicompost, which has high content of exchangeable K, Na, Mg and Ca, with high clay content of the study area soil improved the CEC value of the soil.
The combined use of vermicompost and NPS fertilizer (5 t ha-1 VC +50 kg ha-1 NPS) were increased maize yield (by 60.05%) over control treatment, which is better improvement than sole application of recommended NPS fertilizer (by 52.27%) and vermicompost (55.72%). From these findings one can conclude that integrated application of organic and mineral fertilizers are more valuable than sole use of the fertilizers in improving fertility of study area soils which in turn increased crop yields. Based on the findings and conclusions of this study one can conclude that in order to maintain soil fertility and sustain maize crop production, farmers of the study area and similar agro ecologies are advised to make integrated use of vermicompost at (5 t ha-1) and NPS inorganic fertilizer at (50 kg ha-1) tentatively.
Conflict of Interest: The authors declare that they have no conflict of interests on the manuscript
Acknowledgments
The authors are grateful to the Ethiopian Agricultural offices for the financial support and Ambo University for facilitating the
budget for the research.
- Vanlauwe B, Bationo A, Chianu J, Giller KE, Merckx R, et al. (2010) Integrated soil fertility management: operational definition and consequences for implementation and dissemination. Outlook on Agric 39: 17-24.
- Zamir MSI, Yasin G, Javeed HMR, Ahmad AUH, Tanveer A, et al. (2013) Effect of different sowing techniques and mulches on the growth and yield behavior of spring planted maize (Zea may L.). Cercetări Agronomic in Moldova, 1: 77-82.
- Zeinab AB, Hossein Z, Masoud R (2014) Effect of Vermicompost andChemical Fertilizers on Growth Parameters of three Corn Cultivars. J Appl Sci Agric 9: 22-6.
- Abera Y and T Belachew (2011) Local perceptions of soil fertility management in southeastern Ethiopia. Int Res J Agric Sci 1: 64-9.
- Wakene N, and Heluf G (2004) The Impact of Different Land Use Systems on Soil Quality of Western Ethiopian Alfisols, International Research Food Security: Natural Resource Management and Rural Poverty Reduction through Research for Development and Transformation, Deutcher Tropentage-Berlin 1-7.
- Yadav A and Garg VK (2011) Recycling of organic wastes by employing, Eisenia fetida. Bioresource Technology, 102: 2874–80.
- Alam MN, Jahan MS, Ali MK, Ashraf MA and Islam MK (2014) Effects of vermicompost and chemical fertilizers on growth, yield and yield components of potato in barind soils of Bangladesh, Journal Applied Science Research, 3: 1879-88.
- Tolera A, Tolcha T, Tesfaye M, Haji K and Buzuayehu T (2018) Effect of Integrated Inorganic and Organic Fertilizers on Yield and Yield Components of Barley in Liben Jawi District. International Journal of Agronomy, 10: 1-7.
- Tariku B, Tolera A and Ermiyas H (2018) Effect of Integrated Nutrient Management on Growth and Yield of Food Barley (Hordeum vulgare L.) Variety in Toke Kutaye District, West Showa Zone, Ethiopia. Advances in Crop Science and Technology, 6: 1-8.
- Abera W, Hussein S, Derera M, Worku D (2013) Preferences and constraints of maize farmers in the development and adoption of improved varieties in the mid-altitude, sub-humid agro-ecology of Western Ethiopia. African Journal of Agricultural Research, 8: 1245-54.
- Lazcano C, Gómez-Brandón M and Domínguez (2008) Comparison of the effectiveness of composting and Vermicomposting for the biological stabilization of cattle manure. Chemosphere, 72: 1013-9.
- Suparno P, Talkah B and Soemarno A (2013) Applicationof vermicompost on organic mustard farming in Kediri. Indonesian Green Technology Journal 2: 78-83 (in Indonesian).
- Ahmadabadi Z, Ghajarspanlo M and Rahimialashti S (2011) Effect of vermicompost on soil chemical and physical properties, Science and Technology of Agriculture Natural Resources. Soil and Water Sci 58: 125-37.
- Fekadu S, Brandon MG, Franke IH, Praehauser B, Insam H, et al. (2014) Coffee husk composting: An Investigation of the Process Using Molecular and Non-Molecular Tools. Waste Management, 34: 642-52.
- ATA (Agricultural Transformation Agency). 2014. Soil fertility status and fertilizer recommendation atlas for Tigray regional state, Ethiopia. MOA; ATA, Addis Abeba.
- ATA (AgriculturalTechnology Agency). 2009. Directory of Released Crop Varieties Addis Ababa, Ethiopia
- Arif, MI, Amin MT, Jan I, Munir K, Nawab NU, et al. (2010) Effect of Plant Population, Nitrogen Levels and Methods of Application on Ear Characters and Yield of Maize.
- Sahlemedhin S and Taye B (2007) Procedure for soil and plant analysis Technical Bulletin No.74.National Soil Research Center, Ethiopian Agricultural Organization, Addis Ababa, Ethiopia.
- Day PR (1965) Particle Fraction and Particle Size Analysis Methods of Soil Analysis Black, C.A. (Ed.) 9. Am Soc Agro 20: 545-67
- Soil Survey Staff. 1999. Soil Taxonomy. A basic system of soil classification for making and interpreting soil surveys. Second edition. Agriculture Handbook 436.Washington, DC, USDA. p886.
- Jamison VC, Weaver HH and Reed IF (1950) A hammer-driven soil core sampler. Soil Science, 69: 487-96.
- Rao M, Singa P and Raju MJ (2005) Laboratory Manual on Soil Physicochemical Properties. Aditha Art Printers, New Delhi, India.
- Rowell DL (1994) Soil Science: Methods and Applications. Longman and Scientific Technical, Harlow UK., ISBN-13: 9780470221419, Pages: 350
- Reynolds SG (1970) The gravimetric method of soil moisture determination part I: a study of equipment, and methodological problems. J of Hydrol 11: 258-73.
- Peech M (1965) Hydrogen-ion activity. pp. 914-26. In: CA, Black, D.D. Evans, J.L. Ensminger and F.E. Clark (eds). Methods of Soil Analysis. Part II.ASA, WI, Madison, USA.
- Walkly A and Black IA (1934) An Examination of digestion method for determining soil organic matter and a proposed modification of the chromic acid titration. Soil Sci 37: 29-38.
- Nelson DW and Sommers LE (1996) Total Carbon, Organic Carbon, and Organic Matter, In: Sparks, D.L., Eds., Methods of Soil Analysis, Part 3, Chemical Methods, SSSA Book Series No. 5, SSSA and ASA, Madison, WI, 961-1010
- Jackson ML (1958) Soil Chemical Analysis. Prentice Hall, Inc., Englewood Cliffs. New Jersey
- Bray RH and Kurtz LT (1945) Determination of total organic and available forms of phosphorus in soils. Soil Science, 59: 39-46.
- Murphy J and Riley JP (1962) A modified single solution method for the determination of phosphorus in natural waters. Analytica Chimica Acta, 27: 31-6.
- Warman PR and Sampson HG (1992) Evaluation of soil sulfate extractants and method of analysis for plant available sulfur. Communication in Soil Science and Plant Analysis, 7: 793-803.
- Jackson ML (1973) Soil Chemical Analysis, Prentice Hall India Pvt Ltd, New Delhi, India, 498-516.
- Hesse PR (1972) A text book of soil chemical analysis, John Murray Limited, London, Great Britain. 470p
- USDA (United State Department of agriculture) .2017. GAIN Report on Ethiopia (report No ET1634). Global Agricultural Information Network.
- Chapman H and Pratt (1961) Methods of analysis for soils, plant and water. University California, Berkeley.
- Bremner JM and Mulvaney CS (1982) Nitrogen total 1. Methods of soil analysis. Part 2. Chemical and microbiological properties,
(methods of soil an2) 595-624. - Olsen SR, Cole CV, Watanabe FS and Dean LA (1954) Estimation of Available Phosphorus in Soil Extraction with Sodium Bicarbonate, USDA Circ.939, U.S. Government Printing Office, Washington DC
- Hesse PR, and Hesse PR (1971) A textbook of soil chemical analysis
- SAS (Statistical Analysis Software).2004. SAS Software Syntax, Version 9.0, SAS Institute, Cary, NC, USA.
- Okoko ENK and Makworo S (2012) Evaluation of the effect of compost and inorganic fertilizer on maize yield in Nyamira District, Southwest Kenya, Kenya Agricultural Research Institute, Regional Research Centre
- Hazelton P and Murphy B (2007) Interpreting soil test results, what do all the numbers mean. Victoria, CSIRO Publishing.
- Negessa G and Tesfaye W (2021) Influence of Organic and Chemical Source Fertilizers on Soil Physicochemical Properties and Nutrient Concentration of Nitisol in Welmera District, Central Ethiopia. World Journal of Agricultural Sciences, 17: 295-307.
- Negassa W, Abera T, Minale Liben TD, Workayehu T, Menna A, et al. (2012) Soil Fertility Management Technologies for Sustainable Maize Production in Ethiopia, In Meeting the Challenges of Global Climate Change and Food Security through Innovative Maize Research, page 123).
- Landon JR (1991) Booker Tropical Soil Manual: A Hand Book for Soil Survey and Agricultural Land Evaluation in the Tropics and
Subtropics. Booker Tate limited, London, England. - Papini R, Valboa G, Favilli FL, abate G (2011) Influence of land use on organic carbon pool and chemical properties of Vertic Cambisols in central and southern Italy, Agricultural Ecosystem Environ.140: 68-79
- Pandey KK and Awasthi A (2014) Integrated nutrient management in the maize (Zea mays L.) yield and soil properties. Int J of
Agric Sci 10: 244-2 - Berhanu, D (1980) The physical criteria and their rating proposed for land evaluation in the highland region of Ethiopia. Land
Use Planning and Regulatory Department, Ministry of Agriculture, Addis Ababa, Ethiopia. - Tekalign T, Haque I and Aduayi EA (1991) Soil, plant, water, fertilizer, animal manure and compost analysis manual. Plant Science Division working document, ILCA, Addis Ababa, Ethiopia.13: 103 pp.
- Tesfaye W, Kibebew K, Bobe B, Melesse T and Teklu E (2018) Long Term Effects of Cultivation on Physicochemical Properties of
Soils at Metahara Sugar Estate. American- Eurasian Journal of Agricultural Research, 18: 246-57. - Tekalign M and Haque I (1991a) Phosphorus status of some Ethiopian soils. III. Evaluation of some soil test methods for available
phosphorus. Tropical Agriculture, 68: 51-6. - Jones JB (2003) Agronomic Handbook: Management of Crops, Soils, and Their Fertility. CRC Press LLC, Boca Raton, FL, USA.
482p. - Priya S, Kaushik MK, Sharma SK, and Priyanka K (2014) Impact of integrated nutrient managemnet on growth and productivity of hybrid maize (Zea mays L.), Annals of Biol 30: 106-8.
- Raman S (2018) Effect of integrated nutrient management on the growth and yield of hybrid maize, Journal of Agricultural Research, 3: 1-4.
- Tekalign M and Haque I (1991b) Phosphorus status of some Ethiopian soils, II.Forms and distribution of inorganic phosphates and their relation to available phosphorus. Tropical Agriculture, 68: 2-8
- Tilahun G (2007) Soil fertility status as influenced by different land uses in Maybar areas of South Wello Zone, North Ethiopia.
MSc. Thesis, Haramaya University, Haramaya, Ethiopia.40. - Brady N and Weil R (2008) The nature and properties of soils, 14th edition. Prentice Hall, Upper Saddle River. 992.
- Demir Z, and Gulser C (2015) Effects of rice husk compost application on soil quality parameters in greenhouse conditions.
European Journal of Soil Science 4: 185-90 - Tesfaye W, Kibebew K, Bobe B, Melesse T and Teklu E (2019) Effects of Subsoiling and Organic Amendments on Selected Soil Physicochemical Properties and Sugar Yield in Metahara Sugar Estate. American- Eurasian J Agric Res 19: 312-25.
- Hillel D (1998) Environmental Soil Physics. Academic Press, London, England
- Sanginga N and Woomer PL (2009) Integrated Soil Fertility Management in Africa: Principles, Practices and Development Process, CIAT, Nairobi, ISBN: 978929059261, Pages: 263
- Mirzaei K, Sabahi H and Damghani A (2009) Application of organic fertilizers and soil physical and chemical properties and dry matter production of tomato, J of Agric Res 7: 257-26.
- Murphy HF (1968) A report on fertility status and other data on some soils of Ethiopia. Collage of Agriculture HSIU. Experimental Station Bulletin No. 44, Collage of Agriculture: 551p.
- Tesfaye W, Kibebew K, Bobe B, Melesse T and Teklu E (2020) Effects of long term sugarcane production on soils physicochemical properties at Finchaa sugar Estate. J of Soil Sci and Environ Manage 11: 30-40.
- Tekalign T (1991) Soil, plant, water, fertilizer, animal manure andcompost analysis.Working document No. 13.International
LivestockResearch center for Africa, Addis Ababa. - Angelova VR, Akova VI, Artinova NS and Ivanov K (2013) The effect of organic amendments on soil chemical characteristics.
Bulgarian Journal of Agricultural Science 19: 958-71 - Zupanc V, and Zupanc JM (2010) Changes in soil characteristics during landfill leach ate irrigation of populous deltoids. Waste Management, 30: 2130-36.
- Landon JR (2014) Booker Tropical Soil Manual: A Hand Book for Soil Survey and Agricultural Land Evaluation in the Tropics and
Subtropics. Booker Tate limited, London, England. - Sharma UC and Singh K (1991) Integrated management of phosphate and farmyard manure in potato-radish cropping sequence on an acidic soil. J of Indian Soc Soil Sci 39: 468-47.
- Inal A, Günes A, Alpaslan M, Sait Adak M, Taban S, et al. (2003) Diagnosis ofsulfur deficiency and effects of sulfur on yield and yield components of wheat grownin Central Anatolia. Turkey J of Plant Nutr 26: 1483-98
- Habtamu A, Heluf G, Bobe B and Enyew A (2015) Effects of organic and inorganic fertilizers on yield and yield components of maize at Wujiraba Watershed, Northwestern Highlands of Ethiopia. Am J of Plant Nutr and Fertilization Technol 5: 1-15.
- Kebede F and Yamoah C (2009) Soil fertility status and numass fertilizer recommendation of typic hapluusterts in the Northern highlands of Ethiopia. World Applied Sci J 6: 1473-80.
Kibunja CN, Mwaura FB, and Mugendi DN (2010) Long-term land management effects on soil properties and microbial populations in a maize-bean rotation at Kabete, Kenya. Afr J of Agric Res 5: 108-13. - Karmakar S, Gangopadhyay A, Brahmachari K and Bandyopadyay PK (2009) Soil Health Management by applying Vermicompost prepared from Organic Wastes. J of Interacademicia, 13: 412-7
- FAO (Food and Agriculture Organization). 2006. Plant nutrition for food security: A guide for integrated nutrient management. FAO, Fertilizer and Plant Nutrition Bulletin 16, Rome.
- Ibrahim MM, Mahmoud EK, Ibrahim DA (2015) Effects of vermicompost and water treatment residuals on soil physical properties and wheat yield. Int Agrophys (Vc):157-164
- Brar BS, Singh K, Dheri GS, Kumar B (2013) Carbon sequestration and soil carbon pools in a rice–wheat cropping system: Effect of long term use of inorganic fertilizers and organic manure. Soil Tillage Res 128: 30-6.
- Ngome AFE, Becker M and Mtei KM (2011) Leguminous cover crops differentially affect maize yields in three contrasting soil
types of Kakamega, Western Kenya. Journal of Agriculture and Rural Development in the Tropics and Subtropics (JARTS), 112: 1-10. - Mitiku W and Asnakech H (2016) Effect of nitrogen fertilizer on growth, yield and yield components of maize (Zea mays L.) in decha district, southwestern Ethiopia. International Journal of Research- Granthaakayah, 4: 95-100.
- Dagne C (2016) Blended Fertilizers Effects on Maize Yield and Yield Components of Western Oromia, Ethiopia. Agriculture, Forestry and Fisheries 5: 151-62.
- Opala PA, Kisinyo PO, Nyambati RO (2015) Effects of farmyardmanure, urea and phosphate fertilizer application methods on maizeyields in western Kenya. J. Agric. Rural Dev. Trop. Subtrop, 116: 1-9.
- Pisa C, Wuta M (2013) Evaluation of composting performance of mixtures of chicken blood and maize stover in Harare, Zimbabwe. Int.J. Recycl. Organic Waste Agric. 2: 1-11.